· 7 minute read

Precision, Recall, and F1 Score: When Accuracy Betrays You
· · 6 minute read
Introduction
In the last post, we covered Confusion Matrix and Accuracy, the basic metrics for classification machine learning models.
Today, I’ll explain why Accuracy could be a misleading metric when dealing with imbalanced classes.
Then we’ll discuss a few more classification metrics: Precision, Recall, and F1 Score. We’ll see how they can give you a realistic view of a model’s future performance.
Imbalanced Classes
Let’s say you want to build a system to predict if credit card transactions are fraudulent. This system will output one of the two values for any given transaction - Yes (Fraudulent) or No (Genuine).
The output is a categorical variable with two classes - Yes and No.
As you gather real-world data, you notice that only a tiny percentage (let’s say 3%) of transactions are fraudulent. So a dataset with 10,000 observations will have below output class counts:
| Output | Count |
|---|---|
| Yes (Fraudulent) | 300 |
| No (Genuine) | 9700 |
Most observations have No as the output, so it’s the majority class. And Yes is the minority class as it occurs rarely.
When the output variable has such a wide disparity in class frequency, we say the output has imbalanced classes and the dataset is imbalanced.
What if you use this dataset to train a classification model? The model may not have enough observations with the output Yes to learn how to identify fraudulent transactions.
Accuracy will be a poor indicator of a model’s performance for such imbalanced datasets. Read on to find out why.
Accuracy Paradox
Once you’ve trained the model to detect fraudulent transactions, you must evaluate its performance.
Let’s say we have a test set of 1,000 observations. If it contains 3% fraudulent cases as well, it’ll have below output class counts:
| Output | Count |
|---|---|
| Yes (Fraudulent) | 30 |
| No (Genuine) | 970 |
And suppose the test results revealed below:
-
The model predicted all the genuine transactions correctly. Thus we have 970 True Negatives and 0 False Positives.
-
However, the model predicted only one fraudulent transaction correctly. So it generated 29 False Negatives and 1 True Positive.
We can summarize these results in a Confusion Matrix:
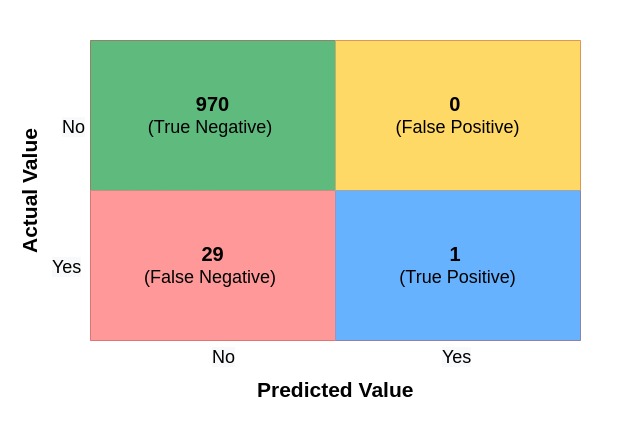
Let’s calculate the model’s Accuracy:
The model has an Accuracy of 97.1%, even though it couldn’t detect 29 out of 30 fraudulent transactions.
How is that possible?
For datasets with imbalanced classes, a model could achieve high Accuracy by predicting the majority class most of the time.
Thus, high Accuracy could be misleading and doesn’t guarantee a well-performing model. This seemingly contradictory phenomenon is known as Accuracy Paradox.
If you cannot trust Accuracy, what other metrics can you use?
It’s time you got to know Precision, Recall, and F1 Score!
Precision
Precision answers the below question:
What percentage of all the Positive predictions made by the model were accurate?
Here’s the formula to calculate Precision:
Precision is a helpful metric when you want to minimize False Positives.
For example, imagine you’re the loan officer at a bank. You don’t want to approve a loan (Positive) for someone who won’t be able to repay. In reality, their loan should not be approved (Negative).
In such cases, you should aim for a model with high Precision.
Recall
We define Recall as below:
What percentage of all the actual Positives were accurately predicted by the model?
And use the below formula to calculate it:
Recall is a helpful metric when you want to minimize False Negatives.
For example, imagine you’re testing if a patient is infected with a dangerous virus. You don’t want a model that predicts a patient is not infected (Negative) when the patient has the virus (Positive).
In such cases, you should aim for a model with high Recall.
F1 Score
Ideally, we want to build a model with both Precision and Recall as high as possible. But usually, there’s a trade-off - trying to make Precision high will lower Recall and vice versa.
F1 Score is defined as the harmonic mean of Precision and Recall. If any of them becomes extremely low, F1 Score will also go down. Thus, F1 Score can help you find a good balance between Precision and Recall.
Here’s the formula for F1 Score:
A little bit of algebra will get you below easy-to-use form:
Re-evaluating Our Model
Remember that we had trained a model that couldn’t detect 29 out of 30 fraudulent transactions correctly. But it still had an accuracy of 97.1%.
Here’s the Confusion Matrix that summarized the test results:
Let’s calculate Precision, Recall, and F1 Score for this model:
The below table shows the scores for all the metrics:
| Classification Metric | Score |
|---|---|
| Accuracy | 0.971 |
| Precision | 1 |
| Recall | 0.033 |
| F1 Score | 0.065 |
The model has high Accuracy and Precision. But the extremely low Recall and F1 Score scores indicate that we have a terrible model.
Specifically, the Recall score tells us that our model can detect only 3.3% of fraudulent transactions.
That’s an abysmal performance. We must ensure that this model never sees the light of day!
Summary & Next Steps
In this post, we discussed imbalanced classes and how they make Accuracy an unreliable metric for classification models.
Then we learned how to calculate Precision, Recall, and F1 Score. These metrics can help you detect a poorly performing model even when Accuracy cannot.
Next, check out the post where I show you how to generate these metrics using Python and Scikit-Learn.
Title Image by
Karolina Grabowska