· 6 minute read

Using Confusion Matrix and Accuracy to Test Classification Models
· · 6 minute read
Introduction
This post shows you how to measure the performance of classification machine learning models. Here’s what you’ll learn:
- How can you test and evaluate classification models?
- How to interpret possible test outcomes - True Positive, True Negative, False Positive, and False Negative?
- What is a Confusion Matrix, and how to create it from scratch?
- How to calculate Accuracy for a given model?
Evaluating Classification Models
We build classification models when we want to predict categories for given observations. Consider below machine learning tasks:
- Does the patient have diabetes?
- Should we approve the loan for a new customer?
- Is a specific credit card transaction fraudulent?
In each case, the output is categorical - it’s either Yes or No. We typically represent the output Yes with the number 1 and call it a Positive outcome.
Similarly, a No output is denoted by the number 0 and considered a Negative outcome.
Imagine you’ve trained a model for the first problem listed above - “Does the patient have diabetes?“. Let’s evaluate its performance using a test dataset not used in training the model.
Suppose the test dataset contains observations for ten patients. We use the model to predict diagnosis for all of them. Then compare the model prediction with the actual output for each patient:
| Patient # | Actual (Expected) | Predicted |
|---|---|---|
| 1 | 0 | 0 |
| 2 | 0 | 1 |
| 3 | 1 | 1 |
| 4 | 1 | 1 |
| 5 | 0 | 1 |
| 6 | 0 | 0 |
| 7 | 1 | 0 |
| 8 | 0 | 0 |
| 9 | 0 | 0 |
| 10 | 1 | 1 |
Note: 1 or positive means the patient has diabetes. 0 or negative means the patient doesn’t have diabetes.
Confusion Matrix
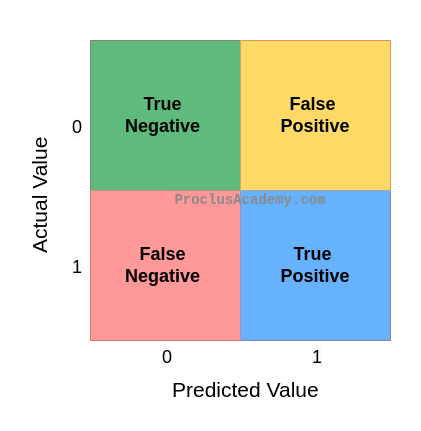
There are four possibilities when you compare the expected category to the model’s prediction:
- True Positive: The expected and predicted values are both positive (1). The model correctly predicted a positive case.
- True Negative: The expected and predicted values are both negative (0). The model correctly predicted a negative case.
- False Positive: The Model made an incorrect positive prediction. The model predicted Positive (1), but the actual value is Negative (0).
- False Negative: The Model made an incorrect negative prediction. The model predicted Negative (0), but the actual value is Positive (1).
True Positive and True Negative are the desired outcomes. In both cases, the model predicted accurately. Conversely, we want our model to minimize the incorrect outcomes - False Positive and False Negative.
We can display these combinations of expected and actual outputs in cross table format:
Let’s go back to our example and label the outcome for each observation in the test set:
| Patient # | Actual | Predicted | Outcome |
|---|---|---|---|
| 1 | 0 | 0 | True Negative |
| 2 | 0 | 1 | False Positive |
| 3 | 1 | 1 | True Positive |
| 4 | 1 | 1 | True Positive |
| 5 | 0 | 1 | False Positive |
| 6 | 0 | 0 | True Negative |
| 7 | 1 | 0 | False Negative |
| 8 | 0 | 0 | True Negative |
| 9 | 0 | 0 | True Negative |
| 10 | 1 | 1 | True Positive |
And count the number of times each outcome occurs:
| Outcome | Count |
|---|---|
| True Negative | 4 |
| True Positive | 3 |
| False Positive | 2 |
| False Negative | 1 |
Let’s plug these counts in the outcomes cross table.
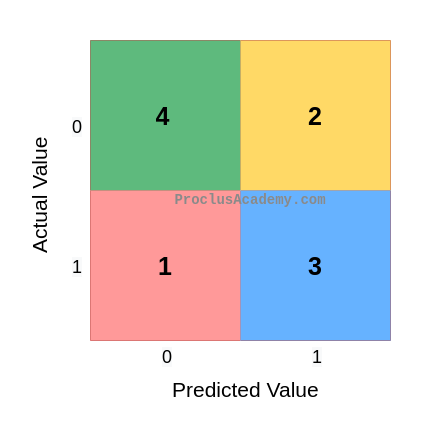
This plot of the outcomes counts is called the Confusion Matrix.
The Confusion Matrix is quite popular because it summarizes the test results succinctly. You can see the combinations of predicted and actual values and their counts in one place.
Accuracy
Accuracy is the simplest metric to measure the performance of a classification model. It answers the below question:
What percentage of predictions did the model get right?
We know that True Positives and True Negatives are the outcomes when the expected result matches the model prediction. Their sum is the total number of correct outcomes. We divide this count by the total number of predictions to get the Accuracy.
Let’s do the calculation for our model:
We can report that our model has 70% accuracy.
Summary & Next Steps
You are now familiar with the basic metrics to evaluate classification models.
You should be able to summarize test outcomes using the Confusion Matrix. And you know how to calculate a model’s Accuracy.
Here’s how you take your knowledge to the next level:
-
Learn how to use Scikit-Learn and Seaborn to evaluate the above metrics.
-
Check out the post where I discuss why Accuracy could be a misleading metric for certain types of problems. And what can you do about that?
Title Image by
TesaPhotography