· 9 minute read

What Is Stratified Sampling and How to Do It Using Pandas?
· · 10 minute read
Sampling
Imagine you want to conduct a study to answer the below question:
How many hours does an average American adult spend watching TV each day?
There are over 256 million adults in America. You can’t possibly ask every adult in America about their TV habits.
So what do you do?
You can select and interview a subset (a sample) of all adults in America. If you choose the sample correctly, you can use it to draw conclusions about the entire population of American adults.
In this post, I’ll cover two techniques for selecting samples. First, we’ll discuss Simple Random Sampling (SRS).
Then we’ll see where SRS could go wrong. And how Stratified Sampling can alleviate the issues with SRS.
Finally, we’ll develop some practical skills. We’ll implement both sampling techniques using Python and Pandas.
Simple Random Sampling (SRS)
In Simple Random Sampling (SRS), everyone in the population has an equal chance of being selected for the sample.
To prepare a sample using SRS, we randomly select the desired number of members from the population.
Let’s say we use SRS to choose a sample of 1000 American adults for the TV study.
Will this sample accurately represent the population? We’re about to find out!
Trouble with SRS
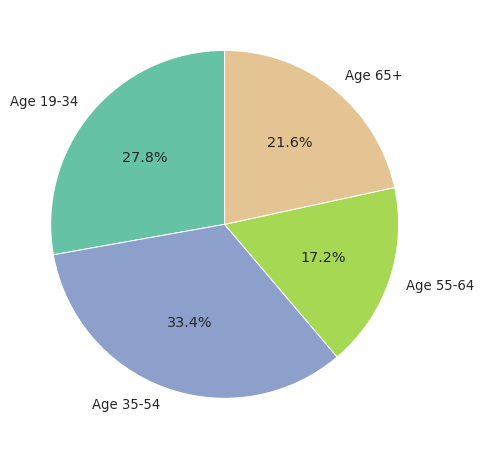
Below pie chart shows how American adults are distributed by the age groups:
Why is this important?
The average time spent on TV varies widely among these age groups. The younger generations spend significantly less time on TV than the older adults.
Therefore, our sample should have a similar proportion of age groups as the entire adult population. If one group is over or under represented, it may exert an undue influence on our conclusions.
SRS cannot guarantee such proportional representation in the samples.
SRS ensures that every adult gets an equal chance to be included in the sample. But SRS chooses each participant at random and independently of others. Therefore, SRS may not maintain the group distribution as we desire.
To illustrate this, I simulated drawing five random samples from the adult population. Here are the proportions of participants by each age group:
| Sample1 | Sample2 | Sample3 | Sample4 | Sample5 | |
|---|---|---|---|---|---|
| Age 19-34 | 24.4 | 28.0 | 30.6 | 31.7 | 27.8 |
| Age 35-54 | 32.4 | 33.5 | 32.2 | 31.2 | 33.7 |
| Age 55-64 | 19.4 | 18.3 | 17.7 | 16.1 | 17.5 |
| Age 65+ | 23.8 | 20.2 | 19.5 | 21.0 | 21.0 |
A couple of things to note:
-
The proportions for the same group can vary wildly across samples. For example, the percentages for the age group 19-34 go from 24.4% to 31.7%.
-
An imbalanced sample can negatively influence the results. In Sample1, the younger generations (ages 19-54) are under represented while older age groups are over represented. Thus, the average TV time calculated using this sample will be higher than the actual population average.
So SRS is incapable of representative sampling. What do we do then?
Stratified Sampling
In Stratified sampling, we divide the population into groups and then draw proportional samples from each group1.
Let’s prepare a sample for the TV study using this technique.
First, we need to answer this question - how many participants do we need to select from each age group?
We already know the expected proportions for each age group. And the sample size is 1000. So we can calculate the count for age group like below:
| Age Group | Expected Percentage | Number of Participants in a Sample of 1000 |
|---|---|---|
| Age 19-34 | ||
| Age 35-54 | ||
| Age 55-64 | ||
| Age 65+ |
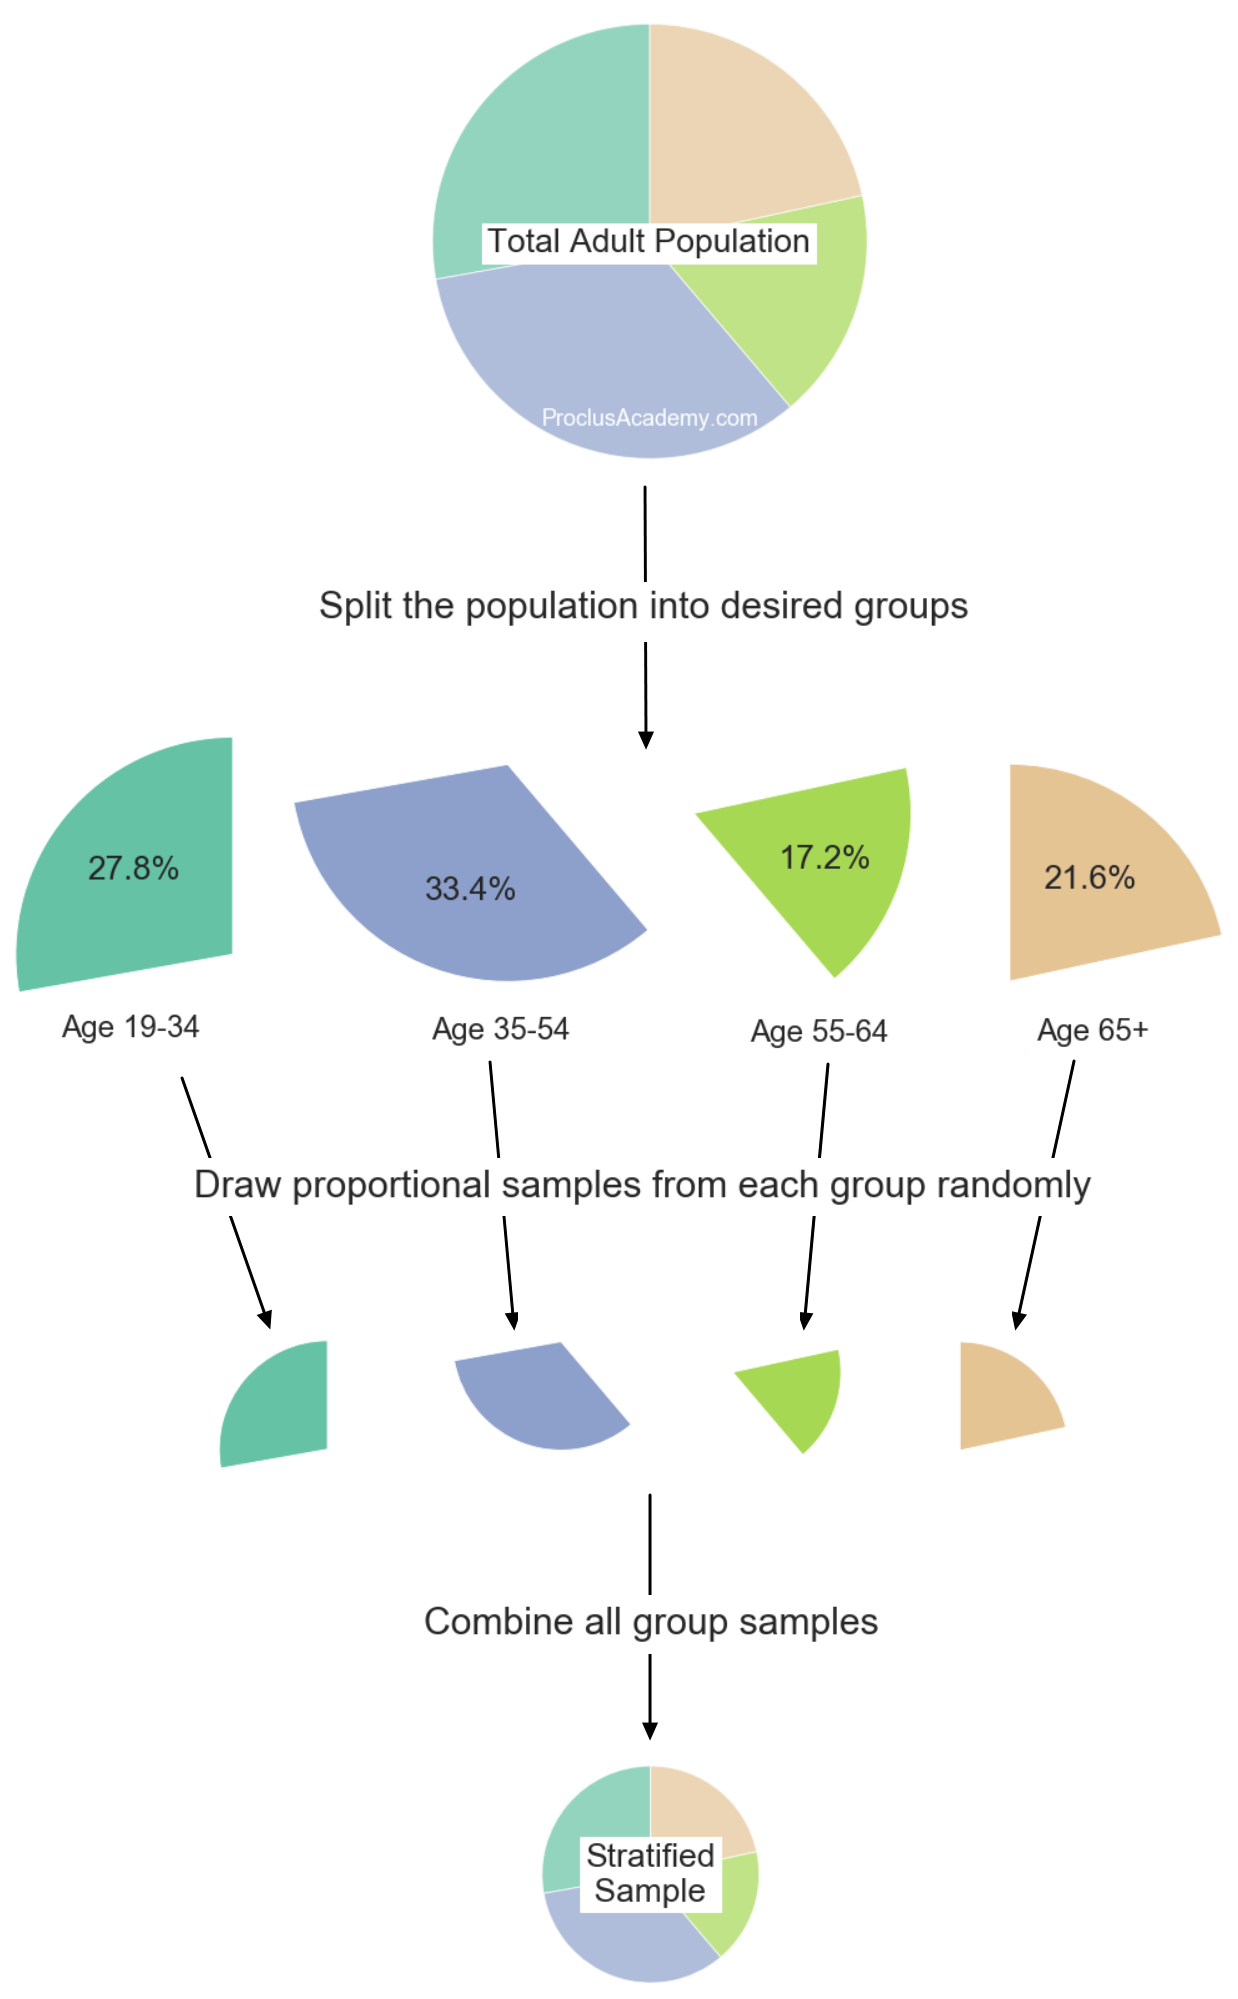
Next, split the population of all American adults into the age groups. Then apply SRS within each group to select the desired number of participants.
Finally, combine the selected participants from all age groups to prepare the sample. This sample will have the same proportion of age groups as the population.
The below figure summarizes the steps taken to prepare the stratified sample:
Hands-On Practice with Pandas
Now we know the theory behind SRS and Stratified Sampling. Let’s learn to implement them using Python and Pandas.
First, allow me to introduce the dataset we’ll use today.
Palmer Penguins Dataset
Palmer Penguins is one of the most exciting datasets I’ve come across recently. Here’s the official description:
The dataset contains data for 344 penguins. There are 3 different species of penguins in this dataset, collected from 3 islands in the Palmer Archipelago, Antarctica.
First, let’s load the dataset.
import pandas as pd
dataset = pd.read_csv('penguins.csv')
dataset.head()| species | island | culmen_length_mm | culmen_depth_mm | flipper_length_mm | body_mass_g | sex | |
|---|---|---|---|---|---|---|---|
| 0 | Adelie | Torgersen | 39.1 | 18.7 | 181.0 | 3750.0 | MALE |
| 1 | Adelie | Torgersen | 39.5 | 17.4 | 186.0 | 3800.0 | FEMALE |
| 2 | Adelie | Torgersen | 40.3 | 18.0 | 195.0 | 3250.0 | FEMALE |
| 3 | Adelie | Torgersen | 36.7 | 19.3 | 193.0 | 3450.0 | FEMALE |
| 4 | Adelie | Torgersen | 39.3 | 20.6 | 190.0 | 3650.0 | MALE |
Next, check how penguins are distributed across the islands. We can do that using Pandas method value_counts():
# Check unique values and their counts
# for the column 'island'
dataset['island'].value_counts()
Biscoe 164
Dream 123
Torgersen 47
Name: island, dtype: int64 Let’s convert these raw numbers into proportions using the normalize=True parameter.
# Get ratio instead of raw numbers using normalize=True
expected_ratio = dataset['island'].value_counts(normalize=True)

# Round and then convert to percentage
expected_ratio = expected_ratio.round(4)*100

# convert to a DataFrame and store in variable 'island_ratios'
# We'll use this variable to compare ratios for samples
# selected using SRS and Stratified Sampling
island_ratios = pd.DataFrame({'Expected':expected_ratio})
island_ratios| Expected | |
|---|---|
| Biscoe | 49.10 |
| Dream | 36.83 |
| Torgersen | 14.07 |
This is the percentage of rows we have for each island. We expect a sample from this dataset to have a similar distribution across islands.
Let’s test the two sampling techniques we learned today.
Simple Random Sampling (SRS)
We can do Simple Random Sampling (SRS) using Pandas method sample().
This method has two ways to specify how many items you want to select.
If you know the exact number of items you want, use the parameter n. In below example, we randomly draw 5 rows from the dataset:
# Choose a Simple Random Sample of 5 items
dataset.sample(n=5)| species | island | culmen_length_mm | culmen_depth_mm | flipper_length_mm | body_mass_g | sex | |
|---|---|---|---|---|---|---|---|
| 144 | Adelie | Dream | 36.0 | 17.1 | 187.0 | 3700.0 | FEMALE |
| 58 | Adelie | Biscoe | 36.4 | 17.1 | 184.0 | 2850.0 | FEMALE |
| 119 | Adelie | Torgersen | 40.6 | 19.0 | 199.0 | 4000.0 | MALE |
| 210 | Chinstrap | Dream | 43.5 | 18.1 | 202.0 | 3400.0 | FEMALE |
| 323 | Gentoo | Biscoe | 43.5 | 15.2 | 213.0 | 4650.0 | FEMALE |
Or, you can use the parameter frac to randomly select a fraction of the dataset.
Below, we choose a random sample with 20% of the rows. Then we calculate the proportion of rows for each island.
# Choose an SRS with 20% of the dataset
srs_sample = dataset.sample(frac=0.20)
# Ratio of selected items by the island
srs_ratio = srs_sample['island'].value_counts(normalize=True)
# Convert to percentage
srs_ratio = srs_ratio.round(4)*100
# We did sampling using SRS. So give it proper name
srs_ratio.name = 'SRS'

# Finally add SRS sample proportions as a column to
# the  variable islands_ratios
island_ratios = pd.concat([island_ratios, srs_ratio], axis=1)
island_ratios| Expected | SRS | |
|---|---|---|
| Biscoe | 49.10 | 59.70 |
| Dream | 36.83 | 28.36 |
| Torgersen | 14.07 | 11.94 |
Check the values for the islands Biscoe and Dream. The proportions generated by SRS are off by 10% from the expected values. The island Biscoe is over represented and Dream is under represented.
So SRS doesn’t work if we want to maintain proportions by a group in the samples.
Let’s try what works.
Stratified Sampling
We’ll implement Stratified Sampling using Pandas methods groupby() and apply():
- First, use
groupby()to split the dataset into 3 groups, one for each island. - Then use
apply()to sample 20% rows within each group. We use lambda function to execute sample() on each group. - Next, combine the rows selected from each group to return the final sample. Pandas will do this step automatically.
# Stratified Sampling
# Use groupby and apply to select sample
# which maintains the population group ratios
stratified_sample = dataset.groupby('island').apply(
    lambda x: x.sample(frac=0.20)
)

stratified_sample.head()| species | island | culmen_length_mm | culmen_depth_mm | flipper_length_mm | body_mass_g | sex | ||
|---|---|---|---|---|---|---|---|---|
| island | ||||||||
| Biscoe | 214 | Gentoo | Biscoe | 46.1 | 13.2 | 211.0 | 4500.0 | FEMALE |
| 298 | Gentoo | Biscoe | 43.4 | 14.4 | 218.0 | 4600.0 | FEMALE | |
| 19 | Adelie | Biscoe | 38.8 | 17.2 | 180.0 | 3800.0 | MALE | |
| 288 | Gentoo | Biscoe | 47.5 | 14.2 | 209.0 | 4600.0 | FEMALE | |
| 292 | Gentoo | Biscoe | 49.1 | 14.5 | 212.0 | 4625.0 | FEMALE |
There is one problem though - groupby() has added island as an index.
Let’s drop the extra index using the Pandas method droplevel(). Pass the parameter 0 as we want to drop the top level index.
# Remove the extra index added by groupby()
stratified_sample = stratified_sample.droplevel(0)
stratified_sample.head()| species | island | culmen_length_mm | culmen_depth_mm | flipper_length_mm | body_mass_g | sex | |
|---|---|---|---|---|---|---|---|
| 214 | Gentoo | Biscoe | 46.1 | 13.2 | 211.0 | 4500.0 | FEMALE |
| 298 | Gentoo | Biscoe | 43.4 | 14.4 | 218.0 | 4600.0 | FEMALE |
| 19 | Adelie | Biscoe | 38.8 | 17.2 | 180.0 | 3800.0 | MALE |
| 288 | Gentoo | Biscoe | 47.5 | 14.2 | 209.0 | 4600.0 | FEMALE |
| 292 | Gentoo | Biscoe | 49.1 | 14.5 | 212.0 | 4625.0 | FEMALE |
The sample looks good now.
Next, we calculate the proportion by each island for this sample.
# Ratio of selected items by the island
stratified_ratio = stratified_sample['island'].value_counts(normalize=True)
# Convert to percentage
stratified_ratio = stratified_ratio.round(4)*100
# We did stratified sampling. So give it proper name
stratified_ratio.name = 'Stratified'

# Add it to the variable island_ratios which already has
# the  expected and SRS proportions
island_ratios = pd.concat([island_ratios, stratified_ratio], axis=1)
island_ratios| Expected | SRS | Stratified | |
|---|---|---|---|
| Biscoe | 49.10 | 59.70 | 49.25 |
| Dream | 36.83 | 28.36 | 37.31 |
| Torgersen | 14.07 | 11.94 | 13.43 |
The proportions generated by the Stratified Sampling look much better! All of them are within 1% of the expected values.
Summary & Next Steps
We covered a lot of ground today. Let’s do a quick recap.
Now you know why we need to do sampling. You are familiar with two ways to select samples from a population.
You understand Simple Random Sampling (SRS). And why SRS may not produce samples that accurately represent the population. You know Stratified Sampling, which gives you samples with desired group proportions.
Finally, you’ve gained valuable practical skills. You can now implement SRS and Stratified Sampling using Python and Pandas.
Here’s what you can do to build on the foundation you’ve laid today:
-
Research other sampling strategies such as Cluster and Systematic sampling.
-
Learn about Sampling Bias. What are the various types of biases? How do you avoid them?
-
Read up on Train Test Split and Cross-Validation. Both use sampling to train and evaluate machine learning models.
Footnotes
-
Stratum is a fancy term for group in Statistics. Hence the technique is called Stratified Sampling. I wish it was called Grouped Sampling. ↩
Title Image by
Pixel-mixer