· 6 minute read

ColumnTransformer: Why and How to Use It to Preprocess Data
· · 10 minute read
Let's explore why you should always use ColumnTransformer to prepare datasets with different column types.
Introduction
The columns in your dataset may need special handling. That’s especially true when you transform them to train a machine learning model.
For example, numerical columns need scaling, and categorical columns should be encoded. And you would want to vectorize columns with text data.
Some columns are fine just the way they are. You don’t want to change them in any way.
How can you apply these different transformations to different types of columns?
We’ll look at three approaches:
- Apply Transformations Sequentially
- Split, Transform and Combine
- Use ColumnTransformer
By the end of this post, you’ll see why you should always use the third approach.
A Motivating Example
We’ll use a simplified version of the titanic dataset. Here are a few sample rows:
| CLASS | GENDER | AGE | FARE | RELATIVES | SURVIVED |
|---|---|---|---|---|---|
| 3 | male | 26.51 | 7.75 | 0 | 0 |
| 3 | male | 40.50 | 7.75 | 0 | 0 |
| 1 | female | 18.00 | 227.52 | 1 | 1 |
| 3 | female | 5.00 | 12.48 | 0 | 1 |
| 2 | male | 32.00 | 10.50 | 0 | 0 |
| 1 | female | 36.00 | 120.00 | 3 | 1 |
| 1 | female | 22.00 | 66.60 | 1 | 1 |
| 3 | male | 25.00 | 7.22 | 0 | 0 |
| 1 | female | 24.00 | 263.00 | 5 | 1 |
| 3 | female | 4.00 | 16.70 | 2 | 1 |
Let’s have a closer look at the columns:
Categorical Columns: CLASS & GENDER
There are only three possible values for passenger’s CLASS: 1, 2, and 3. Similarly, the column GENDER has only two unique values: male and female.
Both columns contain categorical data and, therefore, should be encoded.
Numerical Columns: AGE, FARE & RELATIVES
Some machine learning algorithms perform better if numerical inputs have roughly similar mean, standard deviation, and range.
These statistics differ significantly for our numerical columns:
| Column | Mean | Standard Deviation | Range |
|---|---|---|---|
| AGE | 29.32 | 13.28 | 79.58 |
| FARE | 32.20 | 49.69 | 512.33 |
| RELATIVES | 0.90 | 1.61 | 10.00 |
We’ll need to scale these columns. Scaling will set their mean to 0 and standard deviation to 1.
‘Skip’ Column: SURVIVED
The column SURVIVED has only two possible values: 0 and 1. Therefore it’s already in encoded form. We should leave it as is.
In summary, here are the columns and how we want to transform them:
| Column(s) | Transformation |
|---|---|
| CLASS, GENDER | Encode |
| AGE, FARE, RELATIVES | Scale |
| SURVIVED | Skip |
How do we apply these transformations?
Let’s begin with the first of our three approaches.
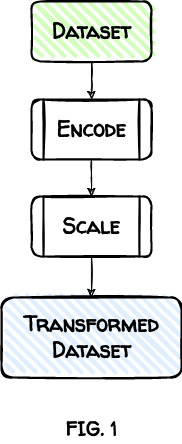
1. Apply Transformations Sequentially
In this approach, the dataset undergoes a series of transformations, applied one after another.
The output of one transformation becomes the input for the next transformation.
For the titanic dataset, we’ll first encode it. Then we’ll take the encoded dataset and scale it.
Let’s see this in action. First, we load the dataset:
import pandas as pd

titanic = pd.read_csv('titanic.csv')
titanic.info()
<class 'pandas.core.frame.DataFrame'>
RangeIndex: 891 entries, 0 to 890
Data columns (total 6 columns):
# Column Non-Null Count Dtype
--- ------ -------------- -----
0 CLASS 891 non-null int64
1 GENDER 891 non-null object
2 AGE 891 non-null float64
3 FARE 891 non-null float64
4 RELATIVES 891 non-null int64
5 SURVIVED 891 non-null int64
dtypes: float64(2), int64(3), object(1)
memory usage: 41.9+ KBtitanic.head()| CLASS | GENDER | AGE | FARE | RELATIVES | SURVIVED | |
|---|---|---|---|---|---|---|
| 0 | 3 | male | 22.0 | 7.25 | 1 | 0 |
| 1 | 1 | female | 38.0 | 71.28 | 1 | 1 |
| 2 | 3 | female | 26.0 | 7.92 | 0 | 1 |
| 3 | 1 | female | 35.0 | 53.10 | 1 | 1 |
| 4 | 3 | male | 35.0 | 8.05 | 0 | 0 |
1.1 Apply Encoding
We encode columns CLASS and GENDER using pandas’ method get_dummies().
It’s standard practice to drop the first level of each encoded categorical column. We’ll do that using the drop_first argument.
titanic = pd.get_dummies(titanic, columns=['CLASS', 'GENDER'],
                         drop_first=True)
titanic.head()| AGE | FARE | RELATIVES | SURVIVED | CLASS_2 | CLASS_3 | GENDER_male | |
|---|---|---|---|---|---|---|---|
| 0 | 22.0 | 7.25 | 1 | 0 | 0 | 1 | 1 |
| 1 | 38.0 | 71.28 | 1 | 1 | 0 | 0 | 0 |
| 2 | 26.0 | 7.92 | 0 | 1 | 0 | 1 | 0 |
| 3 | 35.0 | 53.10 | 1 | 1 | 0 | 0 | 0 |
| 4 | 35.0 | 8.05 | 0 | 0 | 0 | 1 | 1 |
The new encoded columns (in green) look good.
1.2 Apply Scaling
Next, we scale using sklearn’s StandardScaler:
from sklearn.preprocessing import StandardScaler

scaler = StandardScaler()
scaled_titanic = scaler.fit_transform(titanic)

titanic = pd.DataFrame(scaled_titanic, columns=titanic.columns)
titanic.head()| AGE | FARE | RELATIVES | SURVIVED | CLASS_2 | CLASS_3 | GENDER_male | |
|---|---|---|---|---|---|---|---|
| 0 | -0.55 | -0.50 | 0.06 | -0.79 | -0.51 | 0.90 | 0.74 |
| 1 | 0.65 | 0.79 | 0.06 | 1.27 | -0.51 | -1.11 | -1.36 |
| 2 | -0.25 | -0.49 | -0.56 | 1.27 | -0.51 | 0.90 | -1.36 |
| 3 | 0.43 | 0.42 | 0.06 | 1.27 | -0.51 | -1.11 | -1.36 |
| 4 | 0.43 | -0.49 | -0.56 | -0.79 | -0.51 | 0.90 | 0.74 |
As expected, the numerical columns AGE, FARE, and RELATIVES (in green) are scaled.
But we have a problem. All the other columns were scaled as well.
That’s not what we intended. We had encoded categorical columns in the previous step. But they were scaled in this step and don’t contain 0s and 1s anymore (in yellow).
The column SURVIVED (in red) suffered a similar fate.
1.3 The Fatal Flaw
The sequential approach applies every transformation, one after another, to every column.
For example, we wanted to apply only one transformation, encoding, to the column GENDER. However, we encoded and then scaled it.
A better technique will ensure that we don’t apply unwanted transformations to any column.
That’s what our second approach will do.
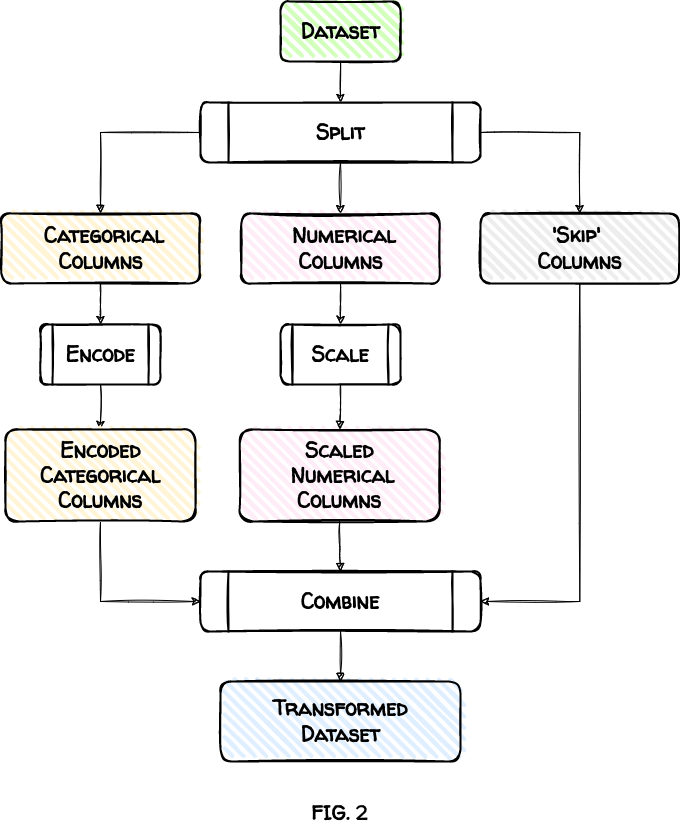
2. Split, Transform and Combine
This approach works in 3 steps:
-
Split the input dataset into subsets based on the column types.
For example, we’ll split the
titanicdataset into three subsets. The first will have numerical columns. The second will contain categorical columns. The columns we don’t want to transform will go in the third ‘Skip’ subset. -
Transform each subset based on its column type.
Each subset is independent and only gets the transformations it needs. That means we’ll scale the numerical subset and encode the categorical subset.
-
Combine all the subsets to create our final, transformed dataset.
Let’s see these steps in action.
titanic = pd.read_csv('titanic.csv')
titanic.head()| CLASS | GENDER | AGE | FARE | RELATIVES | SURVIVED | |
|---|---|---|---|---|---|---|
| 0 | 3 | male | 22.00 | 7.25 | 1 | 0 |
| 1 | 1 | female | 38.00 | 71.28 | 1 | 1 |
| 2 | 3 | female | 26.00 | 7.92 | 0 | 1 |
| 3 | 1 | female | 35.00 | 53.10 | 1 | 1 |
| 4 | 3 | male | 35.00 | 8.05 | 0 | 0 |
2.1 Split Dataset
We split the titanic dataset into three subsets:
- Categorical columns:
CLASSandGENDER - Numerical columns:
AGE,FARE, andRELATIVES - ‘Skip’ columns:
SURVIVED
categorical_columns = titanic.loc[:, ['CLASS', 'GENDER'] ]
numerical_columns = titanic.loc[:, ['AGE', 'FARE', 'RELATIVES']]
skip_columns = titanic.loc[:, ['SURVIVED']]
2.2 Apply Transformations
Let’s transform each subset according to its column type.
Encode Categorical Columns
We encode using OneHotEncoder:
from sklearn.preprocessing import OneHotEncoder

encoder = OneHotEncoder(dtype='int', drop='first')
encoded_raw = encoder.fit_transform(categorical_columns)

categorical_columns = pd.DataFrame(
    encoded_raw.toarray(),
    columns=encoder.get_feature_names_out()
)
categorical_columns.head()| CLASS_2 | CLASS_3 | GENDER_male | |
|---|---|---|---|
| 0 | 0 | 1 | 1 |
| 1 | 0 | 0 | 0 |
| 2 | 0 | 1 | 0 |
| 3 | 0 | 0 | 0 |
| 4 | 0 | 1 | 1 |
Scale Numerical Columns
Next, we scale using StandardScaler:
scaler = StandardScaler()
scaled_raw = scaler.fit_transform(numerical_columns)

numerical_columns = pd.DataFrame(
    scaled_raw,
    columns=numerical_columns.columns
)
numerical_columns.head()| AGE | FARE | RELATIVES | |
|---|---|---|---|
| 0 | -0.55 | -0.50 | 0.06 |
| 1 | 0.65 | 0.79 | 0.06 |
| 2 | -0.25 | -0.49 | -0.56 |
| 3 | 0.43 | 0.42 | 0.06 |
| 4 | 0.43 | -0.49 | -0.56 |
2.3 Combine Subsets
Lastly, we use pandas’ method concat() to combine the subsets. The argument axis='columns' ensures that subsets are stitched horizontally across columns.
titanic = pd.concat(
    [categorical_columns,
    numerical_columns,
    skip_columns], axis='columns')

titanic.head()| CLASS_2 | CLASS_3 | GENDER_male | AGE | FARE | RELATIVES | SURVIVED | |
|---|---|---|---|---|---|---|---|
| 0 | 0 | 1 | 1 | -0.55 | -0.50 | 0.06 | 0 |
| 1 | 0 | 0 | 0 | 0.65 | 0.79 | 0.06 | 1 |
| 2 | 0 | 1 | 0 | -0.25 | -0.49 | -0.56 | 1 |
| 3 | 0 | 0 | 0 | 0.43 | 0.42 | 0.06 | 1 |
| 4 | 0 | 1 | 1 | 0.43 | -0.49 | -0.56 | 0 |
The final dataset looks good. We didn’t change the column SURVIVED. Other columns were either encoded or scaled, but not both.
Unlike the sequential approach, we didn’t apply any unintended transformation to any column.
Now, let’s look at ColumnTransformer, which does everything we want with virtually no effort.
3. Use ColumnTransformer
We got the desired results using the last approach. But it required a lot of work. We had to split the dataset, transform each subset, and combine all the subsets.
Wouldn’t it be nice if you could list the transformations required for different columns? And the system does all the heavy lifting?
Sklearn’s ColumnTransformer is the answer to your prayers.
Let’s see it action. We start by loading the titanic dataset:
titanic = pd.read_csv('titanic.csv')
titanic.head()| CLASS | GENDER | AGE | FARE | RELATIVES | SURVIVED | |
|---|---|---|---|---|---|---|
| 0 | 3 | male | 22.00 | 7.25 | 1 | 0 |
| 1 | 1 | female | 38.00 | 71.28 | 1 | 1 |
| 2 | 3 | female | 26.00 | 7.92 | 0 | 1 |
| 3 | 1 | female | 35.00 | 53.10 | 1 | 1 |
| 4 | 3 | male | 35.00 | 8.05 | 0 | 0 |
To use ColumnTransformer, we need to pass the columns and their transformations as a list of tuples. Each tuple should have:
- Name: A unique name.
- Transformer: An instance of a transformer like
OneHotEncoderorStandardScaler.Set it topassthroughif you want to skip the columns. - Columns: The list of columns to transform.
Here’s a quick review of the columns and how we want to transform them:
| Column(s) | Transformation |
|---|---|
| CLASS, GENDER | Encode |
| AGE, FARE, RELATIVES | Scale |
| SURVIVED | Skip |
And here’s the corresponding list of tuples:
transformers_list = [
('encode', OneHotEncoder(dtype='int',drop='first'),['CLASS','GENDER']),
('scale', StandardScaler(), ['AGE', 'FARE', 'RELATIVES']),
('skip', 'passthrough', ['SURVIVED'])
]
Next, let’s create an instance of ColumnTransformer using the list of tuples:
from sklearn.compose import ColumnTransformer

column_transformer = ColumnTransformer(transformers_list)
Then we call the fit_transform() method. This one line of code performs all the steps from the previous approach (see FIG. 2).
transformed_raw = column_transformer.fit_transform(titanic)Let’s see the result as a DataFrame:
titanic = pd.DataFrame(
    transformed_raw,
    columns=column_transformer.get_feature_names_out()
)
titanic.head()| encode__CLASS_2 | encode__CLASS_3 | encode__GENDER_male | scale__AGE | scale__FARE | scale__RELATIVES | skip__SURVIVED | |
|---|---|---|---|---|---|---|---|
| 0 | 0.00 | 1.00 | 1.00 | -0.55 | -0.50 | 0.06 | 0.00 |
| 1 | 0.00 | 0.00 | 0.00 | 0.65 | 0.79 | 0.06 | 1.00 |
| 2 | 0.00 | 1.00 | 0.00 | -0.25 | -0.49 | -0.56 | 1.00 |
| 3 | 0.00 | 0.00 | 0.00 | 0.43 | 0.42 | 0.06 | 1.00 |
| 4 | 0.00 | 1.00 | 1.00 | 0.43 | -0.49 | -0.56 | 0.00 |
The final dataset looks good. We transformed (or skipped) every column as expected.
Conclusion
We explored three approaches to preparing dataset columns.
The first approach gave us incorrect results. We cannot use it to apply different transformations to different columns.
The second approach isolated the columns and transformed them independently. However, it required us to do the grunt work. We had to write code for the tricky ‘split, transform, combine’ steps.
The final approach, ColumnTransformer, performed these steps behind the scenes. It required minimal work and delivered the results we wanted.
There’s one more reason why you should always use ColumnTransformer. The other approaches can lead to data leakage, sabotaging your machine learning model.
ColumnTransformer, when used with Pipeline, can help you fix data leakage. I’ll cover this critical topic in another post.
Title Image by
Tama66