· 6 minute read

Robust Scaling: Why and How to Use It to Handle Outliers
· · 6 minute read
Outliers can negatively influence the standard scaling of an input. Here's why we should use robust scaling instead.
Introduction
In an earlier post, we learned that a feature with a larger scaler could dominate other features. That could lead to suboptimal machine learning models.
Similarly, extreme values (outliers) can overshadow other data points for a given feature. That can negatively influence standard scaling.
This post will introduce robust scaling that works well on features with outliers.
Then we’ll discuss why standard scaling succumbs to outliers. And why robust scaling is practically immune to them.
We’ll also gain hands-on experience. We’ll use Python and Scikit-Learn to implement robust scaling.

Robust Scaling
Both standard and robust scalers transform inputs to comparable scales. The difference lies in how they scale raw input values.
Standard scaling uses mean and standard deviation. Robust scaling uses median and interquartile range (IQR) instead.
Robust scaling answers a simple question. How far is each data point from the input’s median? More precisely, it measures this distance in terms of the IQR using the below formula:
The scaled values will have their median and IQR set to 0 and 1, respectively.
The fact that robust scaling uses median and IQR makes it resistant to outliers. Why is that? We’ll find out in the next section.
Mean, Median and Outliers
Consider the list of numbers below. The value is an outlier.
Mean
We use every value in the list to calculate the mean:
The mean, 22, is much larger than the first four values. The outlier, 100, exerts a far greater influence than any other number in the list.
Thus, outliers can significantly alter the mean of an input.
Median
To find the median, we first sort the list. Median is the middle value that splits the list in half.
The list above is already sorted. Thus its median is .
The outlier doesn’t affect the median. That’s because the median doesn’t depend on every value in the list. The last value could have been 1000 or even 10000. And it wouldn’t change the median at all.
Let’s look at another example. This time, we’ll start with a list without any extreme values. Then we’ll add a few outliers.
Dataset: No Outliers
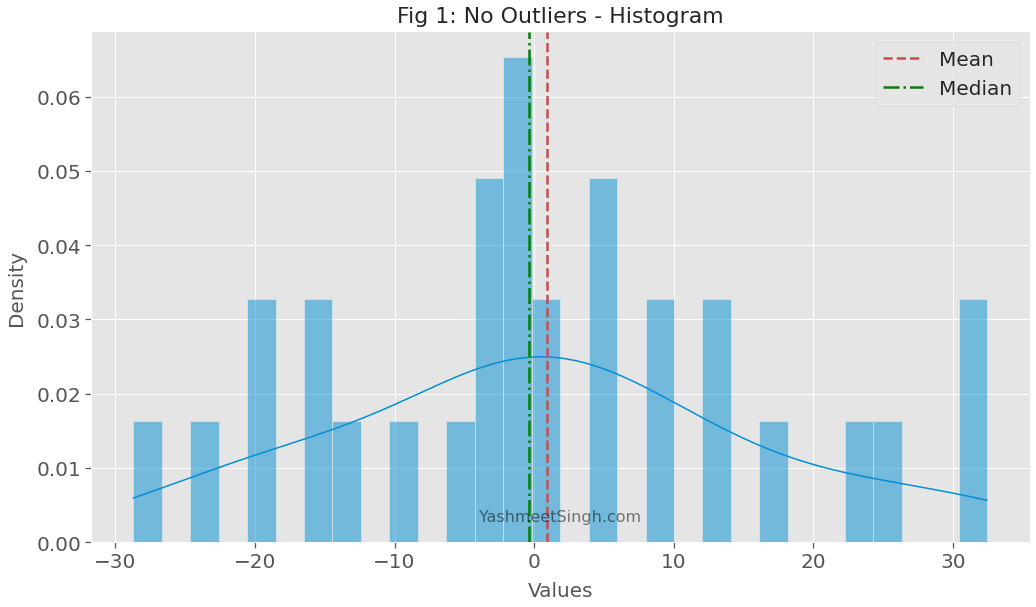
We draw 30 random data points from a normal distribution:
import numpy as np
import pandas as pd

# 30 random points from normal distribution
# with mean = 0 and standard deviation = 15
data = np.random.normal(0, 15, 30)
data_df = pd.DataFrame({"data":data})
Here are the summary statistics for our input list:
| No Outliers | |
|---|---|
| Min | -28.72 |
| Max | 32.45 |
| Range | 61.17 |
| Mean | 0.92 |
| Median | -0.38 |
| Standard Deviation | 15.47 |
| IQR | 17.23 |
The mean and median don’t differ by much. As the below plot shows, both are near the center of the distribution.
We expected that because we sampled the data points from a normal distribution.
Dataset: With Outliers
Now we add a few outliers to our input list:
# 5 outliers ranging from 240 to 250
outliers = np.random.uniform(240, 250, 5)
data_df = pd.DataFrame({
    "data": np.append(data, outliers)
})
Table 2 below shows statistics before and after we added the outliers:
| No outliers | With outliers | |
|---|---|---|
| Min | -28.72 | -28.72 |
| Max | 32.45 | 248.51 |
| Range | 61.17 | 277.23 |
| Mean | 0.92 | 35.71 |
| Median | -0.38 | 1.50 |
| Standard Deviation | 15.47 | 87.64 |
| IQR | 17.23 | 24.30 |
Outliers caused the mean to shoot up from 0.92 to 35.71. The mean is now even higher than the maximum value of the original list (32.45)!
Median, however, increased by a minimal amount.
Figure 2 below confirms this as well.
The median is still close to the center of the original distribution. But the mean has moved significantly away from the center.
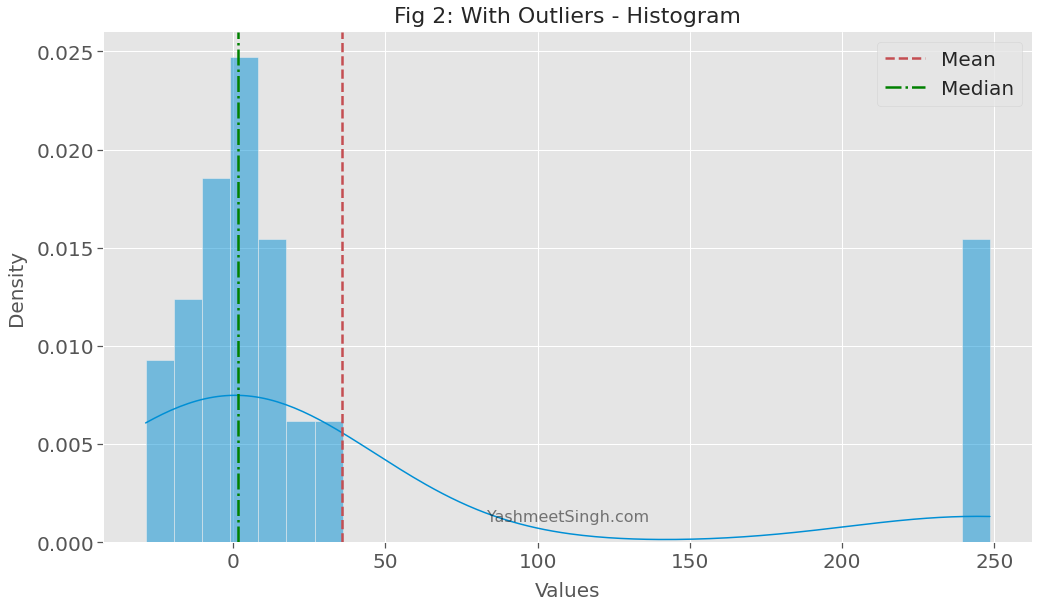
Table 2 also shows that the standard deviation increased by a significant magnitude. However, IQR increased by a much smaller amount.
Therefore, both median and IQR are pretty resistant to outliers.
As we saw in the previous section, robust scaling uses median and IQR to scale input values. That makes it immune to outliers too.
Let’s take robust scaling for a spin.
Robust Scaling in Action
We’ll use sklearn’s RobustScaler to transform the input list with outliers:
from sklearn.preprocessing import RobustScaler

robust_scaler = RobustScaler()

# calculate median and IQR
robust_scaler.fit(data_df)

# scale all data points using median and IQR
robust_scaled_data = robust_scaler.transform(data_df)
We’ll also apply standard scaling to the same data. That way we can compare performance of robust and standard scalers.
from sklearn.preprocessing import StandardScaler
standard_scaler = StandardScaler()
# combine both fit & transform into one call
standard_scaled_data = standard_scaler.fit_transform(data_df)

# dataframe with both standard and robust scaled values
scaled_values = pd.DataFrame({
    'Standard': standard_scaled_data.reshape(-1),
    'Robust': robust_scaled_data.reshape(-1)
})
Table 3 below shows summary statistics for both scalers.
The standard scaler moves the mean to 0 and the standard deviation to 1. Robust scaler changes the median to 0 and IQR to 1.
Notice the ranges of scaled values, though.
| Standard | Robust | |
|---|---|---|
| Min | -0.75 | -1.24 |
| Max | 2.46 | 10.17 |
| Range | 3.21 | 11.41 |
| Mean | -0.00 | 1.41 |
| Median | -0.40 | 0.00 |
| Standard Deviation | 1.01 | 3.61 |
| IQR | 0.28 | 1.00 |
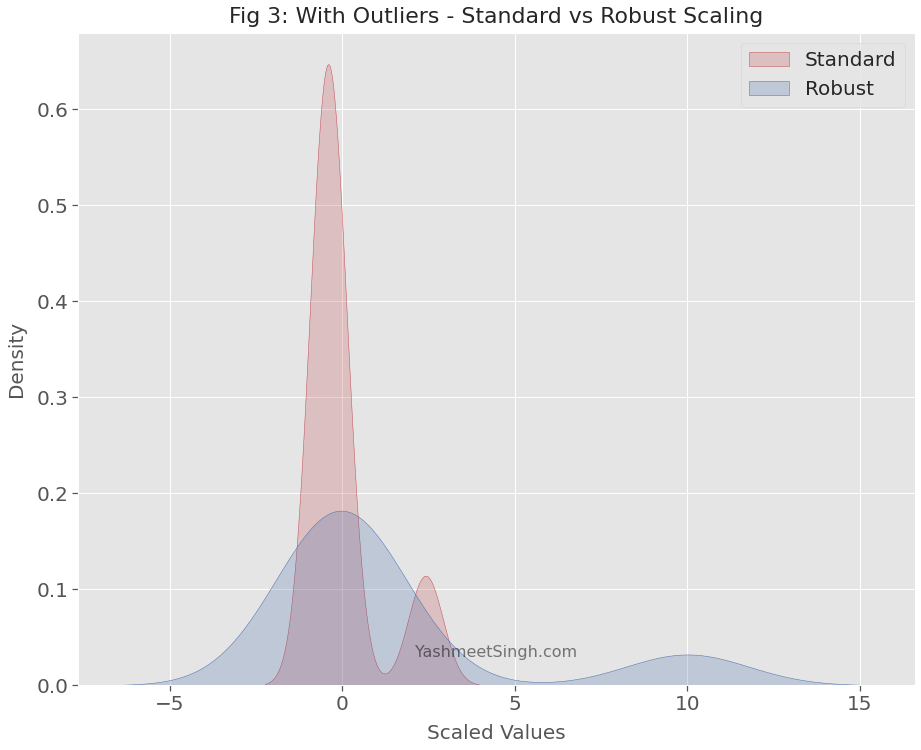
The robust scaler produces a much wider range of values than the standard scaler.
Outliers cause the mean and standard deviation to soar to much higher values. The standard scaler uses these inflated values. Thus, it reduces the relative distance between outliers and other data points.
Hence when outliers are present, the standard scaler produces a distorted view of the original distribution.
Robust scaler doesn’t suffer from this defect. It resists the pull of outliers. Its scaled values have enough range so that the distance between outliers and other values remains largely intact.
Conclusion
Outliers can significantly affect statistics such as mean and standard deviation. Therefore, you may want to avoid using the standard scaling when the input has outliers.
We should use robust scaling instead. It uses median and interquartile range (IQR) to scale input values. Both of these statistics are resistant to outliers. That’s why robust scaling is immune to the adverse influence of outliers.
Parting thoughts
I’ll leave you with a few things to ponder over:
-
We saw that outliers also affect standard deviation more significantly than IQR. Can you think of reasons why that’s the case?
-
How would outliers affect minmax scaling?
-
Suppose your data has multiple numerical features. Only one of them has outliers. How would you scale? Would you:
- Use robust scaling for all features?
- Scale one feature with outliers using robust scaling and others using standard or minmax scaling?
Let me know your thoughts in the comment section below!
Title Image by
lukasbieri