· 7 minute read

How to Customize Pie Charts using Matplotlib
· · 9 minute read
Introduction
Pie charts are as rare as the fish in the sea. Marketers, journalists, politicians, and Instagram influencers - all love using pie charts. I swear I’ve even seen religious gurus use one on TV!
Given the ubiquity of pie charts, Matplotlib fittingly comes with a versatile function, pie() to draw them.
In this post, we’ll explore the function pie() in detail. What are the important parameters? How can we use them to customize pie charts?
Here’s what we’ll cover:
- Slice Colors: Use Matplotlib’s named colors or Seaborn color palettes.
- Labels: How to position and style text and percent labels?
- Customized Slices: Apply styles. Show or hide slices.
- Exploding Pie: Add space between the slices.
- Donut Chart: Draw a pie chart with a hole.
The Data
Suppose you want to visualize how the US population is distributed across age groups. A pie chart would be the ideal plot for you.
Let’s look at the raw data first:
age_group_labels = [
    'Children 0-18', 'Adults 19-25', 'Adults 26-34',
    'Adults 35-54', 'Adults 55-64', 'Seniors 65+'
]

age_group_populations = [
    75307800, 27799100, 39817700,
    81478600, 42061700, 52784400
]

# print age groups and corresponding populations
for label, population in zip(age_group_labels, age_group_populations):
    print (f'{label}:    {population:,}')
Children 0-18: 75,307,800
Adults 19-25: 27,799,100
Adults 26-34: 39,817,700
Adults 35-54: 81,478,600
Adults 55-64: 42,061,700
Seniors 65+: 52,784,400We have the age group and the corresponding population. We want to convert these numbers into proportions (or percentages). And then visualize them.
Let’s draw our first pie chart to do that.
Basic Pie Chart
Matplotlib’s function pie() needs only two parameters to draw a pie chart:
labels: the categorical labels. In our example, it’ll be the age groups.x: the number of occurrences for each label. For example, the population corresponding to each age group.
### imports ###
# matplolib
import matplotlib.pyplot as plt
# seaborn - we'll need it later
import seaborn as sns

# call matplotlib pie() with the minimum required parameters
plt.pie(x=age_group_populations, labels=age_group_labels)
plt.show()
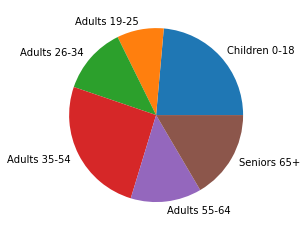
The size of each slice shows the population proportion for the corresponding age group. The plot is too small, though, and doesn’t show the percentages for age groups.
Let’s do a few enhancements:
- Use the parameter
autopctto show the percentage for each slice. - Increase font size for all the text elements using the parameter
textprops. - Increase the plot size to (8x8) using the function figure().
- Add plot title using the function title().
# Increase the size of the plot
plt.figure(figsize=(8,8))

plt.pie(
    x=age_group_populations,
    labels=age_group_labels,
    # show percentage with two decimal points
    autopct='%1.2f%%',
    # increase the size of all text elements
    textprops={'fontsize':14}
)

# Add Title
plt.title(
    label="Population Distribution By Age Groups",
    fontdict={"fontsize":16},
    pad=20
)

plt.show()
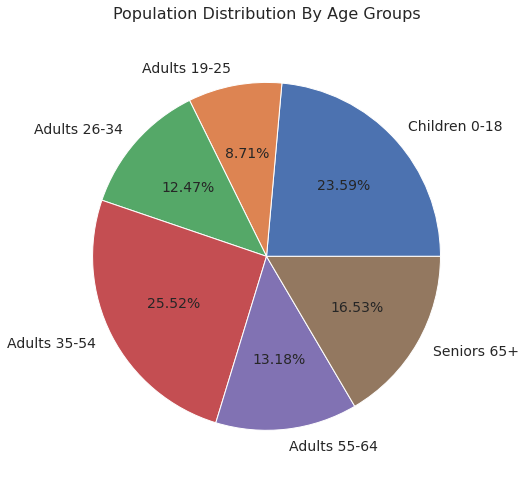
This looks so much better!
Slice Colors
By default, the function pie() uses colors from Matplotlib’s current property cycle.
You can override this behavior by using the parameter color. It accepts a list of colors. The list can contain Matplotlib’s named colors or the standard color codes:
plt.figure(figsize=(8,8))
plt.pie(
    x=age_group_populations,
    labels=age_group_labels,
    autopct='%1.2f%%',
    textprops={'fontsize':14},
    colors=[
        # matplotlib named colors
        'tomato', 'cornflowerblue', 'gold', 'orchid', 'green',
        # any color using the color codes
        "#77BFE2"]
)
plt.show()
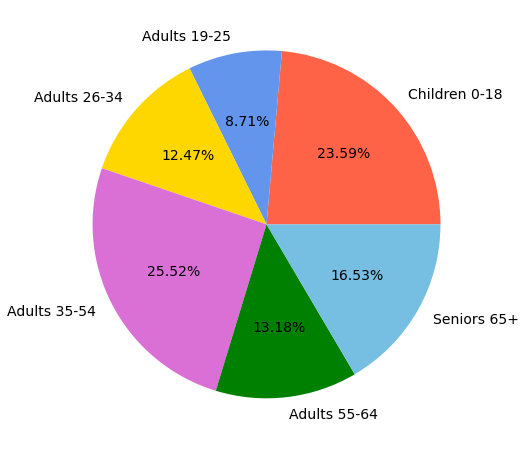
Picking colors is not my strength, though. That should be pretty obvious from the color choices in the plot above 😞.
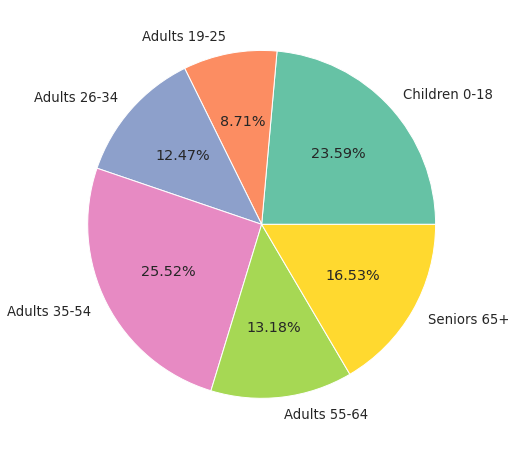
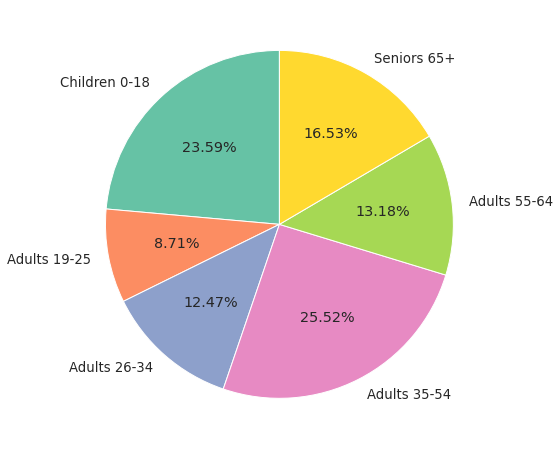
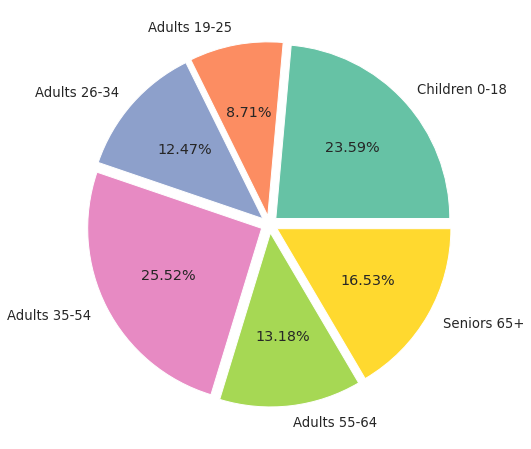
That’s why I like to use Seaborn’s color palettes. We’ll use Set2, my favorite color palette for categorical data. It has beautiful light colors that work well with the overlaid text.
plt.figure(figsize=(8,8))

plt.pie(
    x=age_group_populations,
    labels=age_group_labels,
    autopct='%1.2f%%',
    # Use Seaborn's color palette 'Set2'
    colors=sns.color_palette('Set2')
)
plt.show()
Start Angle and Direction
By default, pie() starts drawing the slices at 0 degrees. (Think of a wall clock - 0 degrees is the position of the hour hand at 3 AM)
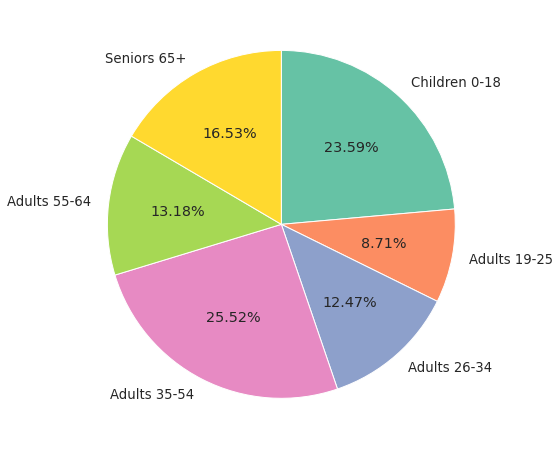
You can change the starting position using the parameter startangle. Below, we set this parameter to 90 degrees so that the Matplotlib starts drawing the first pie (Children 0-18) from the top (12 PM on the wall clock).
# start angle - start at the top
plt.figure(figsize=(8,8))
plt.pie(
    x=age_group_populations,
    labels=age_group_labels,
    autopct='%1.2f%%',
    colors=sns.color_palette('Set2'),
    startangle=90,
)
plt.show()
You’ll also notice that the function pie() draws slices in a counterclock direction. That’s the default behavior.
You can use the parameter counterclock to flip the direction. Below we set this parameter to False, and the slices are plotted clockwise.
plt.figure(figsize=(8,8))
plt.pie(
    x=age_group_populations,
    labels=age_group_labels,
    autopct='%1.2f%%',
    colors=sns.color_palette('Set2'),
    startangle=90,
    # plot slices clockwise
    counterclock=False
)
plt.show()
Text: Positioning and Styles
The Text Labels
You may have noticed that the text labels (age groups) are printed outside of the pie chart.
What if you wanted to render each label within its corresponding slice? And make the label text bold?
Here’s how you can do it:
- Use the parameter
labeldistance. It controls the distance (in terms of radius) between a label and the center of the pie. We’ll set this parameter to 0.7 to pull labels inside the pie. - The function pie() returns a list of Text instances. You can iterate over them and customize labels using various text properties and layout options.
# Scale all text labels using Seaborn's set()
sns.set(font_scale = 1.2)
plt.figure(figsize=(10, 10))

patches, texts = plt.pie(
    x=age_group_populations, labels=age_group_labels,
    colors=sns.color_palette('Set2'),
    startangle=90,
    # Bring labels inside the pie
    labeldistance=0.7
)

# iterate over the text labels
# make each label bold and center-aligned
for text in texts:
    text.set_fontweight('bold')
    text.set_horizontalalignment('center')

plt.show()

The Percent Labels
Recall that you can print the slice percentages using the parameter autopct.
When you do that, the function pie() will return autotexts. It’s a list of Text instances for the percent labels.
You can customize percent labels by doing below:
- Use the parameter pctdistance. It’s the distance (in terms of radius) between a percent label and the center of the pie.
- Iterate over autotexts to apply any style you want.
Let’s print both the text and percent labels inside the slices:
sns.set(font_scale = 1.2)
plt.figure(figsize=(10, 10))

patches, texts, autotexts = plt.pie(
    x=age_group_populations,
    labels=age_group_labels,
    autopct='%1.2f%%',
    colors=sns.color_palette('Set2'),
    labeldistance=0.75,
    # Distance of percent labels from the center
    pctdistance=0.6
)

# Customize text labels
for text in texts:
    text.set_horizontalalignment('center')

# Customize percent labels
for autotext in autotexts:
    autotext.set_horizontalalignment('center')
    autotext.set_fontstyle('italic')

plt.show()
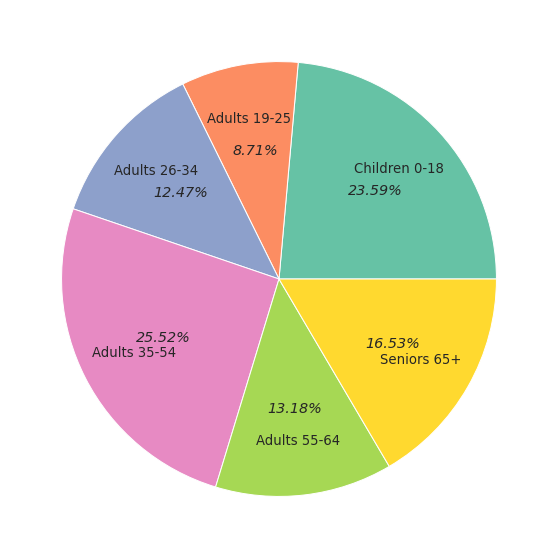
We got both labels inside the slices. But the alignment of both labels is slightly off. You can explore text properties and layout options to fix these alignment issues.
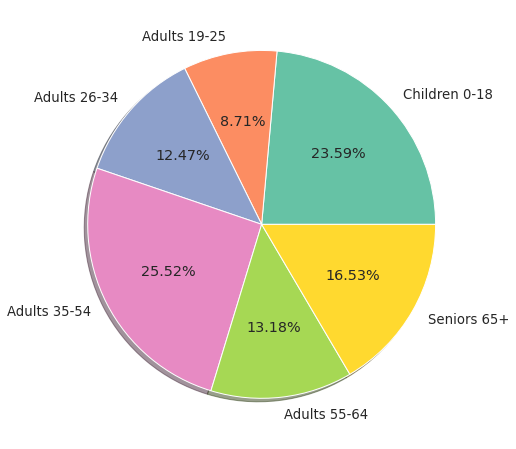
Pie with Shadow
The function pie() allows you to add shadow to the pie chart. You can use the parameter, you guessed it, shadow:
sns.set(font_scale = 1.2)
plt.figure(figsize=(8,8))

plt.pie(
    x=age_group_populations,
    labels=age_group_labels,
    autopct='%1.2f%%',
    colors=sns.color_palette('Set2'),
    # add shadow to the pie chart
    shadow=True
)
plt.show()
Slices
The function pie() returns patches, a list of Wedge instances. You can use these instances to customize each slice.
Let’s look at two examples. First, we’ll hide a slice. Then we’ll show only one slice and change its colors.
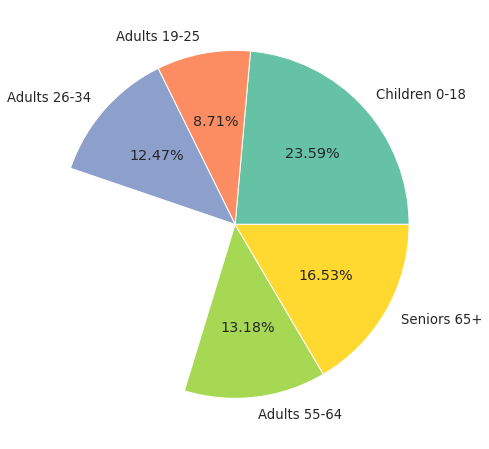
Hide One Slice
Suppose you want to remove one slice (Age Group 35-54) from the pie chart.
We can do that by setting set_visible(False) on the corresponding slice instance (patches[3]). Make sure to hide the related text and percent labels as well:
# Hide only one slice
sns.set(font_scale = 1.2)
plt.figure(figsize=(8,8))

patches, texts, autotexts = plt.pie(
    x=age_group_populations,
    labels=age_group_labels,
    autopct='%1.2f%%',
    colors=sns.color_palette('Set2')
)
# Hide slice Age Group 35-54 and corresponding labels
patches[3].set_visible(False)
texts[3].set_visible(False)
autotexts[3].set_visible(False)

plt.show()
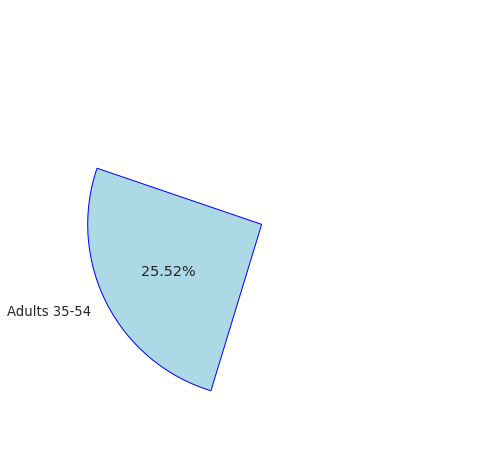
Show Only One Slice
Let’s say you want to do the opposite - show only one slice and customize it.
In the below code, we’ll remove all slices except the Age Group 35-54. Then we’ll change the face and edge colors of the visible slice:
# Show only one slice
sns.set(font_scale = 1.2)
plt.figure(figsize=(8,8))

patches, texts, autotexts = plt.pie(
    x=age_group_populations,
    labels=age_group_labels,
    autopct='%1.2f%%',
    colors=sns.color_palette('Set2')
)

# Iterate over slices
for idx, wedge in enumerate(patches):
    # Hide all slices except the Age Group 35-54
    if (idx != 3):
        wedge.set_visible(False)
        texts[idx].set_visible(False)
        autotexts[idx].set_visible(False)

# Change the face and edge colors for Age Group 35-54 slice
patches[3].set_edgecolor('blue')
patches[3].set_facecolor('lightblue')

plt.show()
Exploding Pie
What if you want to create the illusion that the slices are flying away from the center?
You can do that by using the parameter explode. It allows you to add space (in terms of the pie radius) around slices.
You’ll need to pass a list containing the space for each slice.
Here’s a pie chart with uniform space around all slices:
sns.set(font_scale = 1.2)
plt.figure(figsize=(8,8))

plt.pie(
    x=age_group_populations,
    labels=age_group_labels,
    autopct='%1.2f%%',
    colors=sns.color_palette('Set2'),
    # Add space around each slice
    explode=[0.05, 0.05, 0.05, 0.05, 0.05, 0.05]
)

plt.show()
This looks great! But you can do a lot more with explode.
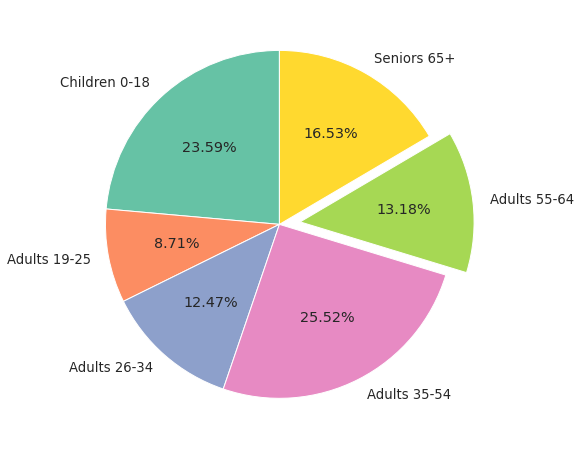
Let’s say you want to emphasize one slice by sticking it out from the pie.
To do so, you’ll need to move only one slice away from the center. You can accomplish this by setting the parameter explode to a list with 0 space for all slices except one.
sns.set(font_scale = 1.2)
plt.figure(figsize=(8,8))

plt.pie(
    x=age_group_populations,
    labels=age_group_labels,
    autopct='%1.2f%%',
    colors=sns.color_palette('Set2'),
    startangle=90,
    # Add space around only one slice
    explode=[0, 0, 0, 0, 0.12, 0]
)
plt.show()
Donut Chart
A Donut chart is a pie chart with a hole at the center. Instead of slices, the donut chart has arcs that are proportional to the categories.
Matplotlib doesn’t have a function to draw a donut chart. So how do you create it?
You can first draw a pie chart using the function pie(). Then overlay a circle to hide the center of the pie.
sns.set(font_scale = 1.2)
plt.figure(figsize=(8,8))

plt.pie(
    x=age_group_populations,
    labels=age_group_labels,
    colors=sns.color_palette('Set2'),
    startangle=90
)

### Add a hole in the pie
# Hole - a white-colored circle of radius 0.65
hole = plt.Circle((0, 0), 0.65, facecolor='white')

# Current Figure ( plt.gcf() )
# --> Current Axis ( gca() )
# --> add the hole
plt.gcf().gca().add_artist(hole)

plt.show()

We got the basic donut chart!
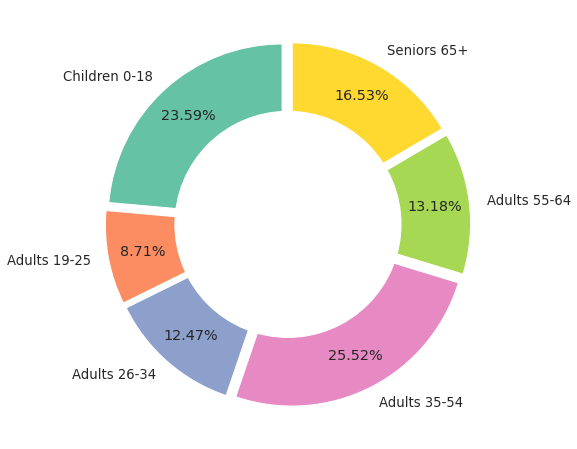
Let’s add a few customizations to jazz it up. We’ll add percentages using the parameter autopct and push them inside the arcs by setting the parameter pctdistance.
We’ll also use the parameter explode to add some space between the arcs.
sns.set(font_scale = 1.2)
plt.figure(figsize=(8,8))

plt.pie(
    x=age_group_populations, labels=age_group_labels,
    colors=sns.color_palette('Set2'),
    startangle=90,
    # show percentages
    autopct='%1.2f%%',
    # move the percentage inside the arcs
    pctdistance=0.80,
    # add space between the arcs
    explode=[0.05, 0.05, 0.05, 0.05, 0.05, 0.05]
)

### Add a hole in the pie
hole = plt.Circle((0, 0), 0.65, facecolor='white')
plt.gcf().gca().add_artist(hole)

plt.show()
Summary
You now have enough practical skills to draw and customize pie charts using Matplotlib.
You know how to control the style and position of the text and percent labels. You can even apply styles tailored to each slice.
Along the way, you learned how to plot an exploding pie chart. Finally, you became familiar with Donut Charts and now have the skills to draw them!