· 10 minute read

NumPy's Random Number Generator: A Practical Guide
· · 12 minute read
Introduction
Randomness plays a crucial role in various fields, including finance, cryptography, statistics, and machine learning. Today, I’ll show you how to simulate randomness using NumPy, the most widely used Python library for numerical computation.
You’ll learn how to:
- Create an instance of a Random Number Generator (RNG).
- Generate random numbers - floats & integers from any specified range.
- Sample numbers from various distributions such as uniform, normal, and exponential.
- Create random subsets from a given population.
- Shuffle the content of an array.
- Get a predictable sequence of random numbers using seed.
Let’s get started!
NumPy’s Default RNG
The NumPy random module provides a method, numpy.random.default_rng(), to create a new random number generator (RNG). Here’s how you can use it:
# import numpy library
import numpy as np

# Create a random number generator instance
rng = np.random.default_rng()
This generator instance rng offers a wide range of methods for generating random numbers. Let’s explore some of the most common use cases.
Random Values Between 0 And 1
The generator’s random() method returns float values between 0 (inclusive) and 1 (exclusive). It samples values from a uniform distribution - all values between 0 and 1 are equally likely to be selected.
By default, random() will return a single value:
# Create an RNG instance
rng = np.random.default_rng()

# Get a single random float value from
# uniform distribution of interval [0, 1)
# - 0.0 (inclusive) and 1.0 (exclusive)
rng.random()0.9435325056105539We can use the size parameter to return array of any shape. The below code will produce a one-dimensional array of 5 random values:
# Generate an array of 5 random numbers
# between 0 (inclusive) & 1 (exclusive)
rng.random(size=5)
array([0.35942103, 0.78480541, 0.59127819, 0.29432856, 0.92272569])You can set size to the shape of the multi-dimensional array you want to generate. The below code will return a 2D array with two rows and four columns:
# Generate a 2D array containing random values
# 2 rows and 4 columns
rng.random(size=(2,4))
array([[0.86933154, 0.36413843, 0.97317681, 0.22452433],
[0.80549587, 0.68089623, 0.47106052, 0.03080547]])Here’s an example code to generate a 3D array:
# Generate a 3D array containing random values
rng.random(size=(2, 4, 3))
array([[[0.8947982 , 0.57363252, 0.39030826],
[0.35467904, 0.65197302, 0.34702842],
[0.50757991, 0.3709357 , 0.05520285],
[0.2504092 , 0.84096304, 0.81815441]],
[[0.66732543, 0.47058759, 0.96984449],
[0.84026075, 0.24506746, 0.56754709],
[0.95595125, 0.78561756, 0.36935028],
[0.46992367, 0.51782683, 0.9018934 ]]])Random Values From Any Interval
As seen above, random() returns values between 0 and 1. NumPy provides another method, uniform(), to help you draw random values from any interval.
The method uniform() takes in two inputs, low and high, to set the lower (inclusive) and upper (exclusive) boundaries, respectively. As the name suggests, all values within this interval are equally likely to be selected.
Let’s use it to sample a single value between 10 and 50:
rng = np.random.default_rng()
# get a random value between 10 and 50
rng.uniform(low=10.0, high=50.0)47.741300224422154Like random(), uniform() has the size parameter to control the shape of the output. The below code returns a 2D array of random values between 10 and 50:
rng.uniform(low=10.0, high=50.0, size=(4,3))array([[24.37684133, 41.39221648, 33.65112741],
[21.77314245, 46.90902746, 44.77326179],
[24.56553705, 48.92707259, 18.98097323],
[42.21983472, 37.23584925, 28.84242085]])Confirm Uniform Distribution Using Histogram
How can we be sure that uniform() returns values from a uniform distribution? One way would be to select a large random sample and then visualize how the sample data is distributed.
Let’s use uniform() to get 100K random values between 10 and 50:
# Get 100K random float values between 10 and 50
values_count =  100000
random_vals = rng.uniform(low=10.0, high=50.0, size=values_count)
Next, we’ll visualize the 100K random values as a histogram with 50 equal-width bins. Since there are 100K values and 50 bins, we expect each bin to have 2000 values.
Here’s the code to draw the histogram using Matplotlib. It adds a horizontal line to show the expected count (2000) in each bin:
# import matplotlib library
import matplotlib.pyplot as plt

bins_count = 50
expected_count_per_bin = values_count/bins_count

# Draw histogram of the random values selected using rng.uniform()
# Use 50 equal-width bins
plt.hist(random_vals, bins=bins_count, edgecolor='black')
plt.xlabel("Value")
plt.ylabel("Frequency")
plt.title("Histogram: Random Values Using NumPy rng.uniform()")

# Add a line showing the expected count of values in each bin
plt.axhline(y=expected_count_per_bin, color='red', linestyle=':', )
plt.show()
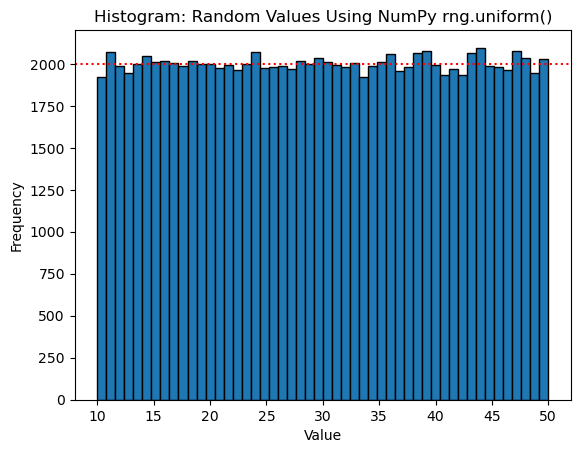
As the dotted red line shows, all the bins have roughly the same number of values. The method uniform() works as advertised - all the values from the given interval have equal chance of being selected.
Random Integer Values
The RNG method integers() lets you generate random integer values from a given interval. The below code returns a random integer value between 3 (included) and 10 (excluded):
# Instantiate NumPy RNG
rng = np.random.default_rng()
# one random number between 3 and 10 (excluded)
rng.integers(3, 10)5If you supply only one input parameter, integers() will select values between 0 and the given parameter. For example, the below code will return a random integer between 0 and 10:
# return integer between 0 (included) and 10 (excluded)
rng.integers(10)9As expected, integers() supports the size parameter. You can use it to get array of any shape. The below code generates an array of 3 random integers between 0 and 10:
# Generate 3 random integer values between 0 and 10
rng.integers(10, size=3)
array([6, 3, 1], dtype=int64)And a 2D array consisting of random values between 0 and 100:
# Generate a 2D array (3 rows & 2 columns) of
# random integer values between 0 and 100
rng.integers(0, 100, size=(3,2))
array([[78, 39],
[59, 61],
[29, 36]], dtype=int64)Endpoint Parameter & integers()
By default, the integers() method excludes the endpoint of the given interval. Let me show this using an example.
The below code asks for three random integers between 0 and 1. Since integers() excludes 1 (endpoint), and there are no other integers between 0 and 1, you’ll get back an array with all zeros:
rng = np.random.default_rng()
# Get 3 random integers between 0 and 1
# Endpoint is excluded, so we'll only get 0s back
rng.integers(0, 1, size=3)
array([0, 0, 0], dtype=int64)You can override this behavior by using the parameter endpoint. If you set it to True, integers() will not exclude the end value in the random selection.
Let’s set this parameter and generate three random integers between 0 and 1 again. The returned array now includes 1:
# Get 3 random integers between 0 and 1
# Parameter endpoint=True ensures that
# 1 is not excluded.
rng.integers(0, 1, size=3, endpoint=True)
array([0, 1, 1], dtype=int64)Normal Distribution
NumPy RNG provides the normal() method to draw random values from a normal distribution.
By default, it returns sample values from a standard normal distribution (mean = 0, standard deviation = 1). The below code returns one such value:
# Initialize NumPy RNG
rng = np.random.default_rng()
# Get a random value from standard normal distribution
# (mean = 0 and standard deviation - 1)
rng.normal()-0.7901524999630146As with most RNG methods, normal() comes with the size parameter to get array of any shape. Let’s use this parameter to get ten random values:
# Draw a sample of 10 values from the
# standard normal distribution
rng.normal(size=10)
array([-2.03462548, 0.60330175, 0.74429453, -0.3096868 , 0.36732137,
1.71039429, 1.06079784, 0.70763902, 0.68774939, -0.86356745])Custom Mean & Standard Deviation
You’re not limited to just the standard normal distribution when using normal(). You can set custom mean and standard deviation values using the parameters loc and scale, respectively.
Let’s look at a practical example.
Suppose you know that men’s shoe sizes in Europe are normally distributed with a mean of 45 and a standard deviation of 3. We can use this information to generate random shoe sizes using normal():
# Europe men's shoe size are normally distributed
# with below mean and standard deviation.
shoe_size_mean = 45
shoe_size_std = 3

# Initiate the NumPy RNG
rng = np.random.default_rng(seed=101)
# Use the RNG normal() to get 5 sample shoe sizes.
# Set the loc and scale parameters to shoe size
# mean and standard deviation, respectively.
rng.normal(loc=shoe_size_mean, scale=shoe_size_std, size=5)
array([42.6295425 , 38.89612355, 46.80990524, 47.23288359, 44.0709396 ])The generated shoe sizes seem realistic. As before, let’s draw a large sample and confirm that normal() works as intended.
The below code generates 100K random shoe sizes using normal() and draws their histogram:
# Generate a random sample of 100K shoes sizes
random_shoes_sizes = rng.normal(
    loc=shoe_size_mean,
    scale=shoe_size_std,
    size=100000
)

# Draw histogram for the 100K sample
# Use 50 equal-width bins
plt.hist(random_shoes_sizes, bins=50, edgecolor='black')
# Draw mean line for reference
plt.axvline(x=shoe_size_mean, color='red', linestyle=':')

plt.xlabel("Shoe Size")
plt.ylabel("Counts")
plt.title("Histogram: Men's shoe size in Europe - Sample size 100K")
plt.show()
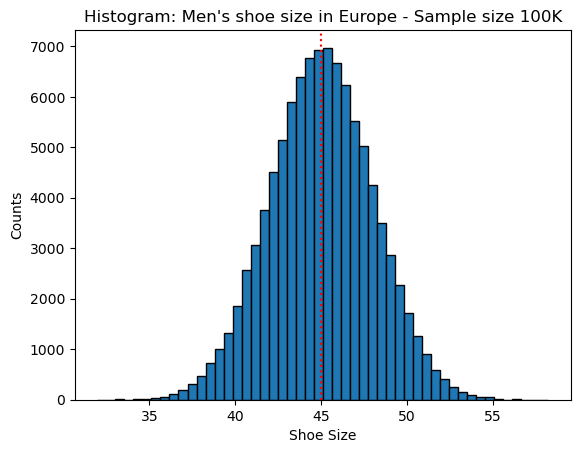
We see the classic form of a normal distribution - a bell-shaped histogram that is symmetrical about the mean. Therefore, it’s safe to conclude that RNG normal() samples values from a normal distribution.
Exponential Distribution
Exponential distribution is used to model the wait time until an event occurs again. For example, how long until a newly purchased lightbulb stops working, or the delay in the arrival of trains at a railway station.
Exponential distribution takes the mean wait time as an input and returns probabilities associated with various wait times.
Suppose you manage a call center and are interested in modeling the time between successive phone calls received by an agent. The mean wait time between calls is 5 minutes.
Let’s use the RNG method exponential() to generate a large random sample (10K) of wait times between calls. You can set the mean wait time using the parameter scale:
# The mean wait time between successive calls
mean_wait_time=5
# Instantiate NumPy RNG
rng = np.random.default_rng()
# Generate 10K random wait times using RNG exponential
# Set the mean wait time using the 'scale' parameter
wait_time_dist = rng.exponential(scale=mean_wait_time, size=10000)
Next, draw a histogram of the generated wait times. By default, Matplotlib’s hist() shows the count for each bin on the Y-axis. We’ll set the density parameter to plot the bin probabilities instead:
# Draw histogram of wait times generated by NumPy RNG exponential()
# Use matplotlib's hist() with 75 bins
# Set 'density' to True to get probability on the Y-axis
plt.hist(
    wait_time_dist,
    bins=75, density=True,
    edgecolor='black'
)
# Show mean wait time for reference
plt.axvline(x=mean_wait_time, color='red', linestyle=':')
# Show the graph up to 30 minutes only
plt.xlim(0, 30)

plt.xlabel("Wait Time (in minutes)")
plt.ylabel("Probability")
plt.title("Exponential Distribution: Wait Time Between Calls")
plt.show()
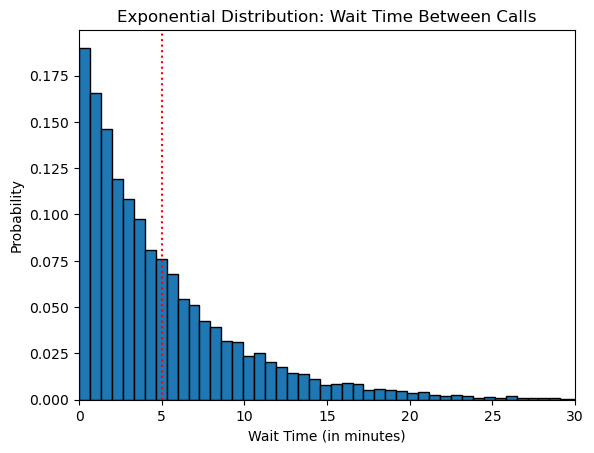
The graph shows the wait times on the X-axis and their corresponding probabilities on the Y-axis.
The probability of a shorter wait time is high. However, the probability decreases rapidly for longer wait times. This is the typical behavior for an exponential distribution.
NumPy RNG supports various other distributions such as Gamma, Poisson, Logistic, etc. I’ll leave it with you to explore them on your own.
Random Samples Using choice()
NumPy RNG choice() lets you select a random subset from a given array. Allow me to illustrate with a couple of examples.
Let’s use NumPy arange() to create an array, population, containing numbers from 0 to 100:
population = np.arange(0, 101)
population
array([ 0, 1, 2, 3, 4, 5, 6, 7, 8, 9, 10, 11, 12,
13, 14, 15, 16, 17, 18, 19, 20, 21, 22, 23, 24, 25,
26, 27, 28, 29, 30, 31, 32, 33, 34, 35, 36, 37, 38,
39, 40, 41, 42, 43, 44, 45, 46, 47, 48, 49, 50, 51,
52, 53, 54, 55, 56, 57, 58, 59, 60, 61, 62, 63, 64,
65, 66, 67, 68, 69, 70, 71, 72, 73, 74, 75, 76, 77,
78, 79, 80, 81, 82, 83, 84, 85, 86, 87, 88, 89, 90,
91, 92, 93, 94, 95, 96, 97, 98, 99, 100])You can use choice() to randomly select a few values from the population array. By default, it returns a single random value:
# Initialize NumPy random number generator
rng = np.random.default_rng()
# Get a random value from an array
rng.choice(population)32As expected, choice() has the size parameter, which allows you to draw samples of any shape. The below code returns a sample of 10 values:
# Get a random sample of 10 values
rng.choice(population, size=10)
array([95, 70, 36, 14, 79, 40, 60, 62, 30, 37])Here’s how you can get a 2D sample from the population array:
# Draw a sample of 8 values in 2D shape
# 2 rows and 4 columns
rng.choice(population, size=(2, 4))
array([[93, 78, 87, 14],
[37, 8, 98, 67]])Sampling With (or Without) Replacement
By default, choice() does sampling with replacement. That is, it allows the same value to be selected more than once during the sampling process.
Let’s see this in action. We’ll store the days of the week in an array. This array will serve as the population from which we want to draw samples.
# Array with all 7 days of a week
days = np.array([
    'Monday', 'Tuesday', 'Wednesday',
    'Thursday', 'Friday', 'Saturday',
    'Sunday'])
days
array(['Monday', 'Tuesday', 'Wednesday', 'Thursday', 'Friday', 'Saturday',
'Sunday'], dtype='<U9')There are only 7 days in a week. However, you can use choice() to draw a sample of 10 days like below:
rng = np.random.default_rng()
rng.choice(days, size=10)
array(['Wednesday', 'Sunday', 'Friday', 'Wednesday', 'Monday', 'Saturday',
'Wednesday', 'Friday', 'Friday', 'Wednesday'], dtype='<U9')The returned sample repeats some days (ex., Wednesday occurs 4 times).
You can override this behavior using the replace parameter. If you set it to False, choice() will do sampling without replacement. Once a value is chosen for a sample, it won’t be considered for that sample again.
Let’s select a sample of 10 days again. We’ll set replace to False:
rng.choice(days, size=10, replace=False)ValueError: Cannot take a larger sample than population when replace is False.
Now, choice() will throw an error as above. Without replacement, it’s impossible to get a sample of 10 days when the population consists of only 7 days!
Shuffle a Given Array
NumPy RNG provides the shuffle() method to randomly rearrange the items in an array. Let’s see a working example.
First, we’ll create an array of sorted numbers using NumPy arange():
array1 = np.arange(12)
array1
array([ 0, 1, 2, 3, 4, 5, 6, 7, 8, 9, 10, 11])Next, use shuffle() to scramble the array content randomly. It’ll do an in-place update to the given array:
# Get a new random number generator
rng = np.random.default_rng()
# Randomly rearrange the array items
# Pass array as a parameter to shuffle()
rng.shuffle(array1)
# Array after shuffle
array1
array([ 3, 11, 9, 7, 1, 8, 0, 5, 4, 10, 6, 2])Shuffle Along an Axis
When you use shuffle() on multi-dimensional arrays, you can decide the dimension along which the array is randomly rearranged. The axis parameter determines whether the shuffling happens row-wise or column-wise.
Let’s create a 2D array and see this in action.
# Create a 2D array of 3 rows and 5 columns
array1 = np.arange(15).reshape(3, 5)
array1
array([[ 0, 1, 2, 3, 4],
[ 5, 6, 7, 8, 9],
[10, 11, 12, 13, 14]])By default, the axis parameter of shuffle() is set to 0. Therefore, the method works along the rows. It’ll randomly change the order of the rows while preserving the order of elements within each row:
# Create NumPy RNG
rng = np.random.default_rng()
# Shuffle 2D array along the rows.
# Order of rows will be changed randomly, but the
# order of elements in each row will remain intact
rng.shuffle(array1)
array1
array([[ 5, 6, 7, 8, 9],
[ 0, 1, 2, 3, 4],
[10, 11, 12, 13, 14]])You can set the axis to 1 to operate shuffle() along the columns. Now, it will rearrange the order of columns while keeping the order of elements within each column unchanged:
# Recreate the same 2D array
array1 = np.arange(15).reshape(3, 5)
print("Original Array: ")
print(array1)
# Shuffle 2D array along the columns (axis=1).
# Order of columns will be changed randomly, but the
# order of elements in each column will remain intact
rng.shuffle(array1, axis=1)
print("Array after shuffle along columns: ")
print(array1)
Original Array:
[[ 0 1 2 3 4]
[ 5 6 7 8 9]
[10 11 12 13 14]]
Array after shuffle along columns:
[[ 1 0 2 4 3]
[ 6 5 7 9 8]
[11 10 12 14 13]]Seeding the NumPy RNG
The NumPy default_rng() method sets up a random number generator with a starting point called a seed. This seed determines the sequence of random numbers generated by an RNG instance.
By default, default_rng() picks up the seed based on your computer’s current state. However, if you set a specific seed value, you’ll get the same sequence of random numbers every time you run the code.
In this article, I created all the RNG instances using 101 as the seed value. Therefore, if you set the seed parameter to 101 in all default_rng() calls, you’ll generate the same random numbers in the same order.
# Set the seed to 101 in all default_rng()
# invocations in this article, and you'll get
# the same random numbers in the same order .
rng = np.random.default_rng(seed=101)
Summary
We covered a lot of ground today. You learned how to use Python and NumPy to generate random numbers. You gained invaluable practical skills along the way.
You should now feel comfortable performing the below tasks on your own:
- Instantiate a new random number generator (RNG) using NumPy’s default_rng().
- Generate random numbers using random() and integers().
- Generate samples from various statistical distributions. Examples - uniform(), normal(), and exponential().
- Use choice() to draw random samples from a population.
- Randomize the order of elements of an array using shuffle().
- Shuffle arrays along a specific axis.
- Use seed to generate a predictable sequence of random numbers.
Title Image by
12019