· 9 minute read

Mastering Z-Scores: From Basics to Practical Applications
· · 10 minute read
Introduction
In previous articles, I explained how to visualize a collection of data in various ways (e.g., histogram, line plot, density curve, etc.). These visualizations show us how the data is distributed and help identify trends, patterns, or outliers in the overall dataset.
However, sometimes, you may be interested in knowing more about a specific value within a distribution. Where does it fall in relation to the rest of the data points? Is it above or below the average? How far away is the value from the mean of the dataset? Is it an outlier?
Z-score can help us answer these questions, especially when working with normally distributed data.
In this article, I will explain the concept of z-score using simple, relatable examples. We’ll start with the basics of z-score and how to calculate it. Then, we’ll learn about using z-score to compare data points across similar distributions. And finally, I’ll show you how to detect outliers using z-scores.
Let’s get started!
What is a Z-Score?
The z-score tells us the position of a value within data distribution using the center and spread of the distribution. Specifically, the z-score measures how many standard deviations a value is from the mean. We can use the below formula to calculate it:
Calculating the Z-score as above is called standardization because it gives us the distance between the value and the mean in terms of standard deviations.
A positive z-score tells us that the value is greater than the mean. In contrast, a value below the mean will produce a negative z-score.
Let’s take an example. Suppose a newborn elephant weighed 250 pounds. You did some research and found that the average birth weight of an elephant is 200 pounds, and the standard deviation is 50 pounds.
We can use this information to calculate the z-score of the newborn elephant:
The baby elephant was born with a weight that’s exactly one standard deviation above the mean weight.
Note that the z-score of the mean value will be 0. You can verify that by plugging in the mean weight (200) in the z-score equation:
You can also do the reverse calculation to get the value for a given z-score. Simply multiply the z-score by the standard deviation and then add that to the mean. Here’s the formula:
Suppose the birth weight of another elephant had a z-score of -0.5. What’s the actual weight in pounds? Let’s find out using the above formula:
You might ask, ”So what if I can convert individual values to z-score, and vice versa? What do we gain by doing that?”
The importance of z-score becomes apparent when we use it with certain statistical distributions. Let’s look at one such example.
Z-scores and Normal Distribution
Normal distribution has some unique properties that make it well-suited for analysis using z-scores.
When we convert all values of a normally distributed variable to z-scores, we create what is known as a standard normal distribution. This new distribution will have a mean of 0 and a standard deviation of 1. Let’s look at a few properties of this distribution.
Center at Z-score = 0
The normal distribution is centered at the mean. Since the standard normal distribution has 0 as the mean, the z-score of 0 will lie at the center.
Symmetry
Mean splits the normal distribution into two symmetrical halves that mirror each other. Thus, the area under the curve from the center to a positive z-score, such as , is equal to the area between the center and the corresponding negative z-score of the same magnitude, .
![Figure shows normal distribution with z-scores on the x-axis. It highlights the symmetry by comparing the shape and area of the intervals [-1.5, 0] and [0, +1.5].](/images/037-normal-dist-zscore-symmetry.webp)
The area under the curve represents the probability of a value falling within a specific interval. Therefore, the two shaded z-score intervals have the same probability. In other words, if you select a random value from a normal distribution, it is equally likely to fall within the interval of as it is to fall within .
Cumulative Probability and Percentile
Cumulative probability is the probability of selecting a random value that is less than or equal to a specific value.
How can we find the cumulative probability of a given z-score in a normal distribution? It’ll be equal to the proportion of area under the curve that lies to the left of the z-score. The below graph highlights this area for a z-score of :
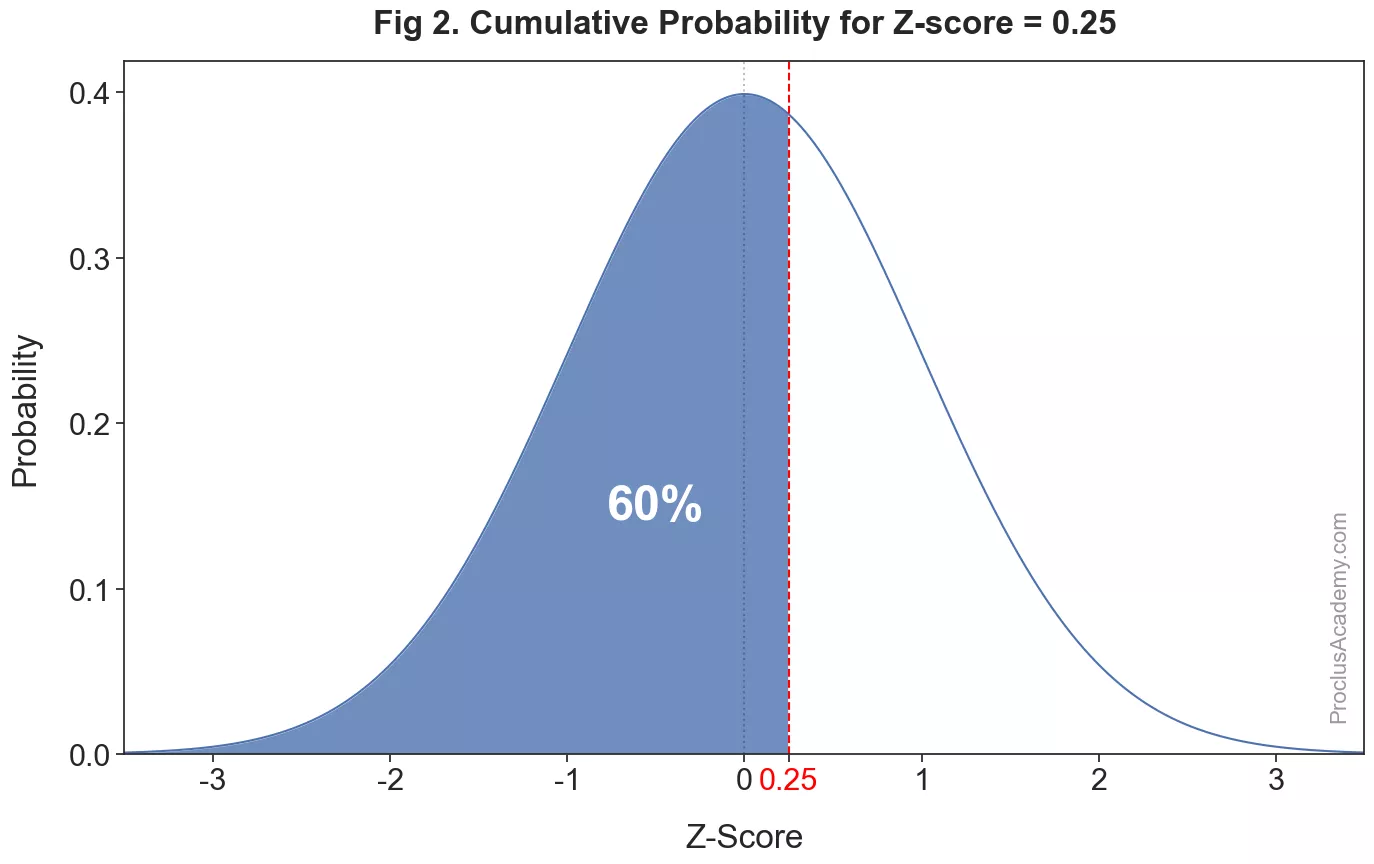
It’s roughly of the total area. Hence the cumulative probability for z-score of is about 0.60.
We can interpret this conclusion in another way - approximately of the values have a z-score lower than . Or we could say that a z-score of represents the th percentile in a normal distribution.
In the example above, I estimated the shaded area to find the cumulative probability and the percentile. You can get their precise values for any given z-score by using the z-score tables or Python with the SciPy library.
Assignment: Review the empirical rule, which tells us the percentage of values that fall within 1, 2, and 3 standard deviations of the mean in a normal distribution. Can you restate this rule in terms of z-scores?
Comparing Values Using Z-Scores
Z-score can help us compare values from two different distributions. Let me illustrate this using an example.
Let’s say you and your cousin, Sunny, are in the same grade but attend different schools. You both got results back from a recent science exam - you scored 80 and Sunny scored 65.
At first glance, it may seem that you performed better because you scored higher. However, it is possible that Sunny’s exam was tougher or his teacher was stricter in grading it. How can we compare these two scores more accurately?
We need to look at how the scores are distributed in each class. Specifically, we can compare how far each score is from the mean of its respective distribution.
Suppose both sets of scores are normally distributed. The mean and standard deviation of the scores in your class were 75 and 10, respectively. In Sunny’s class, the mean score was 55 with a standard deviation of 10.
Let’s calculate the z-score for each of your scores:
Even though Sunny scored lower than you, his score is farther from the mean of his class than your score is from the mean of your class. Specifically, Sunny’s z-score is 1, while yours is only 0.5. Thus, compared to the respective classmates, he performed better than you.
We can look at the cumulative probabilities and percentiles to reinforce this point further. As per the z-table, z-scores of 0.5 and 1.0 have cumulative probabilities of 0.6914 and 0.8413, respectively.
That means you scored more than 69.14% of your classmates. And Sunny’s score was higher than 84.13% of his peers. So don’t be surprised if he starts claiming to be the brains of the family 😉.
Finding Outliers Using Z-Scores
An outlier is an extreme value that occurs far away from the bulk of the observations. Such values are either too big or too small compared to the rest of the values.
Outliers can negatively affect data analysis - they can assert undue influence on statistics such as mean and standard deviation and give you a distorted picture of how data is distributed. Hence, outlier detection is one of the most crucial steps in data analysis.
The question is - how can we detect outliers? As per the empirical rule, 99.7% of the values of a normal distribution fall within 3 standard deviations from the mean. Any value outside of this range is considered an outlier because the probability of getting such a value is only 0.3% - a rarity.
Let me explain this using an example. Suppose you collect data on 200 basketball players for a season and calculate the average number of points they scored per game. And then plot average points per game as a histogram:
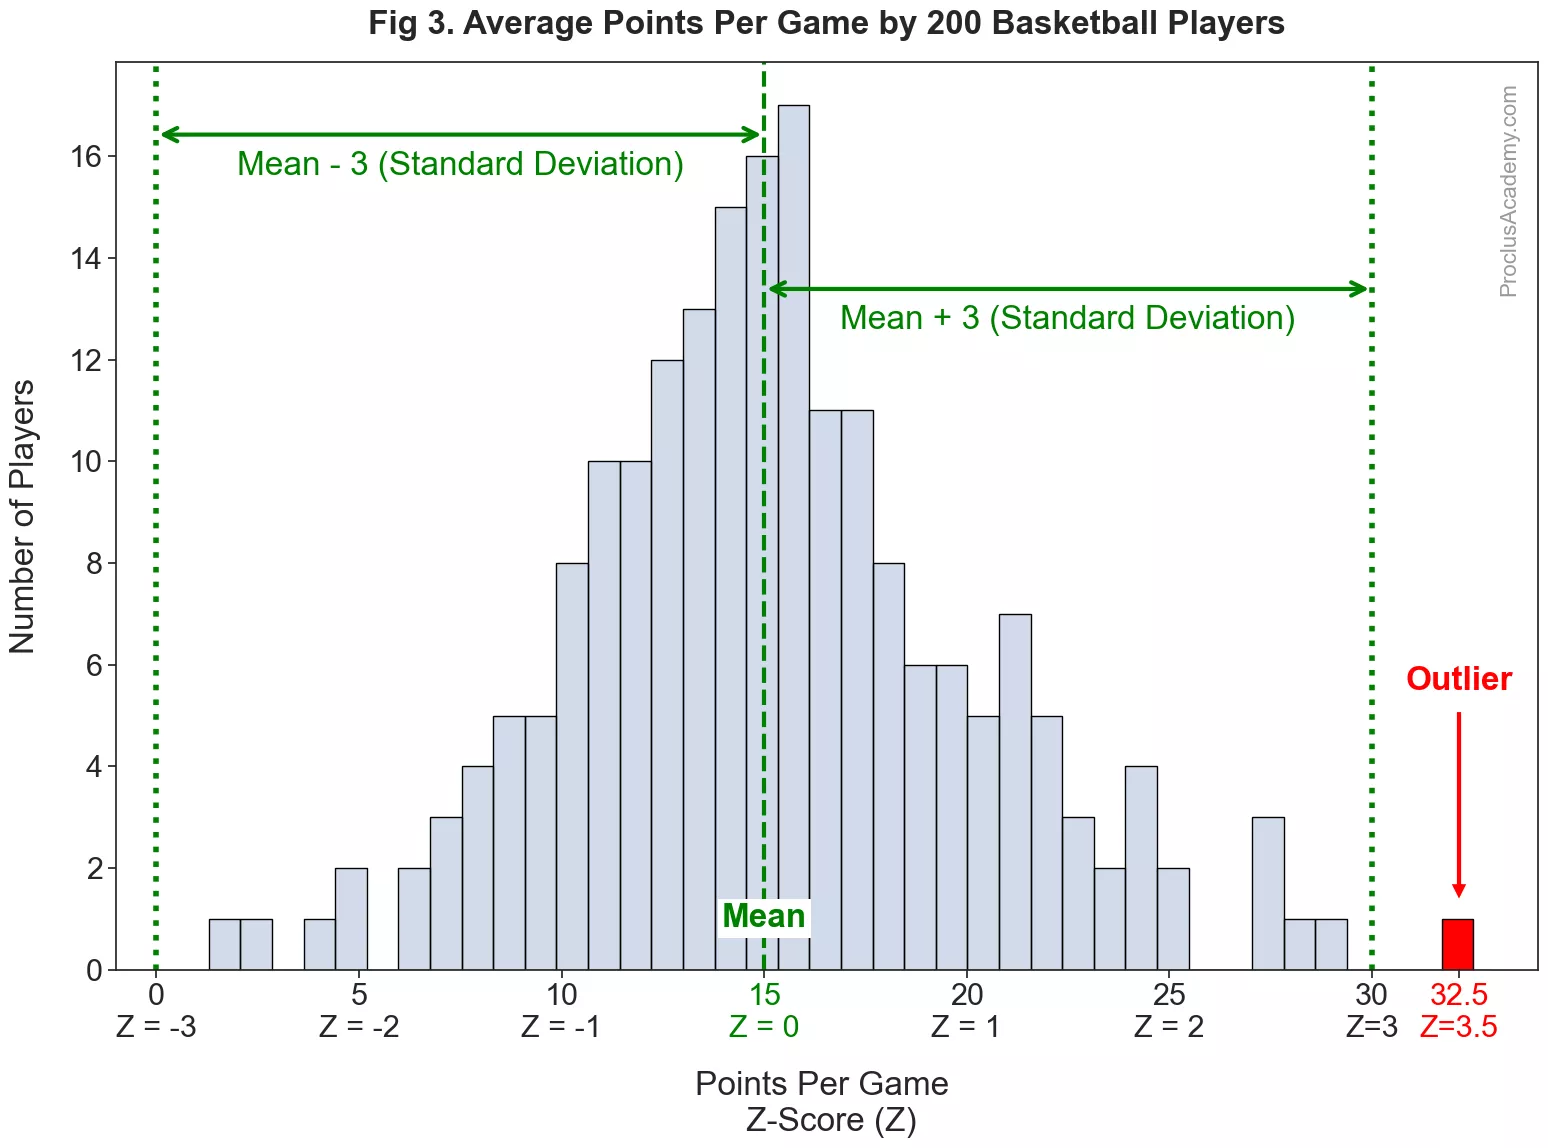
The average points per game are almost normally distributed - a slight variation from the theoretical, smooth curve is expected with real world data. The distribution has a mean of 15 with a standard deviation of 5. Thus, the points per game for most players are in the vicinity of 15.
We can also convert the points per game to z-score. Thus, the mean (15) will have a z-score of 0, and 20 will translate to a z-score of 1, etc. The graph shows the z-scores below the raw points per game on the x-axis.
Almost all the values fall within 3 standard deviations, or within the z-score range of . However, one player finished the season with points per game, which translates to a z-score of . His score is far from the rest of the players and lies beyond the range of 3 standard deviations from the mean. We’ll get such performance very rarely and thus consider it an outlier.
Once we’ve found outliers, we can handle them in many different ways. We can either exclude them from analysis or use measures such as the median, which are not unduly affected by the outliers. See my related post on this topic.
Summary
This article introduced you to the concept of z-score using practical, real-life examples. Let’s quickly recap what you learned today:
-
What is z-score, and how does it help us understand the relative position of an observation within a distribution.
-
What are the special properties of normal distribution (symmetry, predictable area under the curve), and how can we use z-scores and these properties to calculate probabilities and percentiles.
-
How can we use z-scores to compare values from different yet similar distributions?
-
What are outliers, and why is it important to identify them. How can z-score help us detect outliers in normally distributed data.
This in-depth knowledge of z-score provides you with a solid foundation for advanced concepts in statistics. Watch out for my next article on correlation coefficient, where we’ll see how z-score plays a crucial role in defining the relationship between two variables.
Title Image by
kolibri5