This article teaches you how to extract HTML table data from web pages using Pandas and Python.
You'll also learn to handle a typical error you may encounter when scraping web pages.

Let me show you how to interact with a SQL database using Pandas and Python.
You'll learn to write a DataFrame to a database table and load an entire table or results of a SQL query into a DataFrame.

Let's explore all the ways you can use Pandas to interact with Excel files.
I'll show you how to read spreadsheets, load selected columns and worksheets, and write DataFrames to Excel files.

Here's all you need to know to start using Pandas for data analysis.
You'll learn how to read, manipulate, sort, filter, and visualize datasets using various Pandas methods.

How do you quantify the distance between a typical value and the center of a dataset?
Let's examine the three most common metrics to measure how values are spread out.
How can you choose one value that summarizes and captures the essence of a given data set?
Let's examine four measures that you can use to represent such a central value.

Are you ready to embark on your machine learning journey? Let me be your guide.
I’ll share the topics you’ll need to learn, the best available resources, and the order in which to study them.

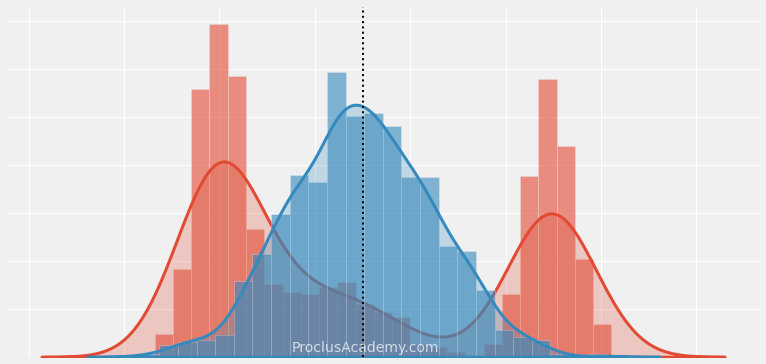
How can you generate samples from a Normal Distribution? How do you calculate probabilities and percentiles?
You'll learn to do all of that using SciPy. I'll also show you how to plot histograms and density curves for normally distributed data.

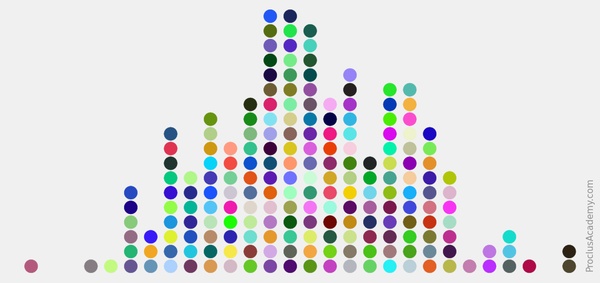
Matplotlib doesn't support dot plots natively. So how can you draw them?
Let's write our own function and use it to sketch highly customizable dot plots.
How can we use Scikit-Learn to measure Precision, Recall, and F1 Score for classification models?
Also, does Scikit-Learn provide a way to handle imbalanced classes?